Matthew Wyczalkowski
Contact Details
Jump to
Scientific illustration and data visualization
As a researcher in a prominent cancer genomics research lab, I communicate complex scientific concepts through informative grapics. I have created numerous figures for publications in prominent journals, and led illustration design for a number of successful large scale grants. Below is a representative selection of my work, highlighting images which were published or in a successful grant application.
Graphical Abstract in Cell (2023)
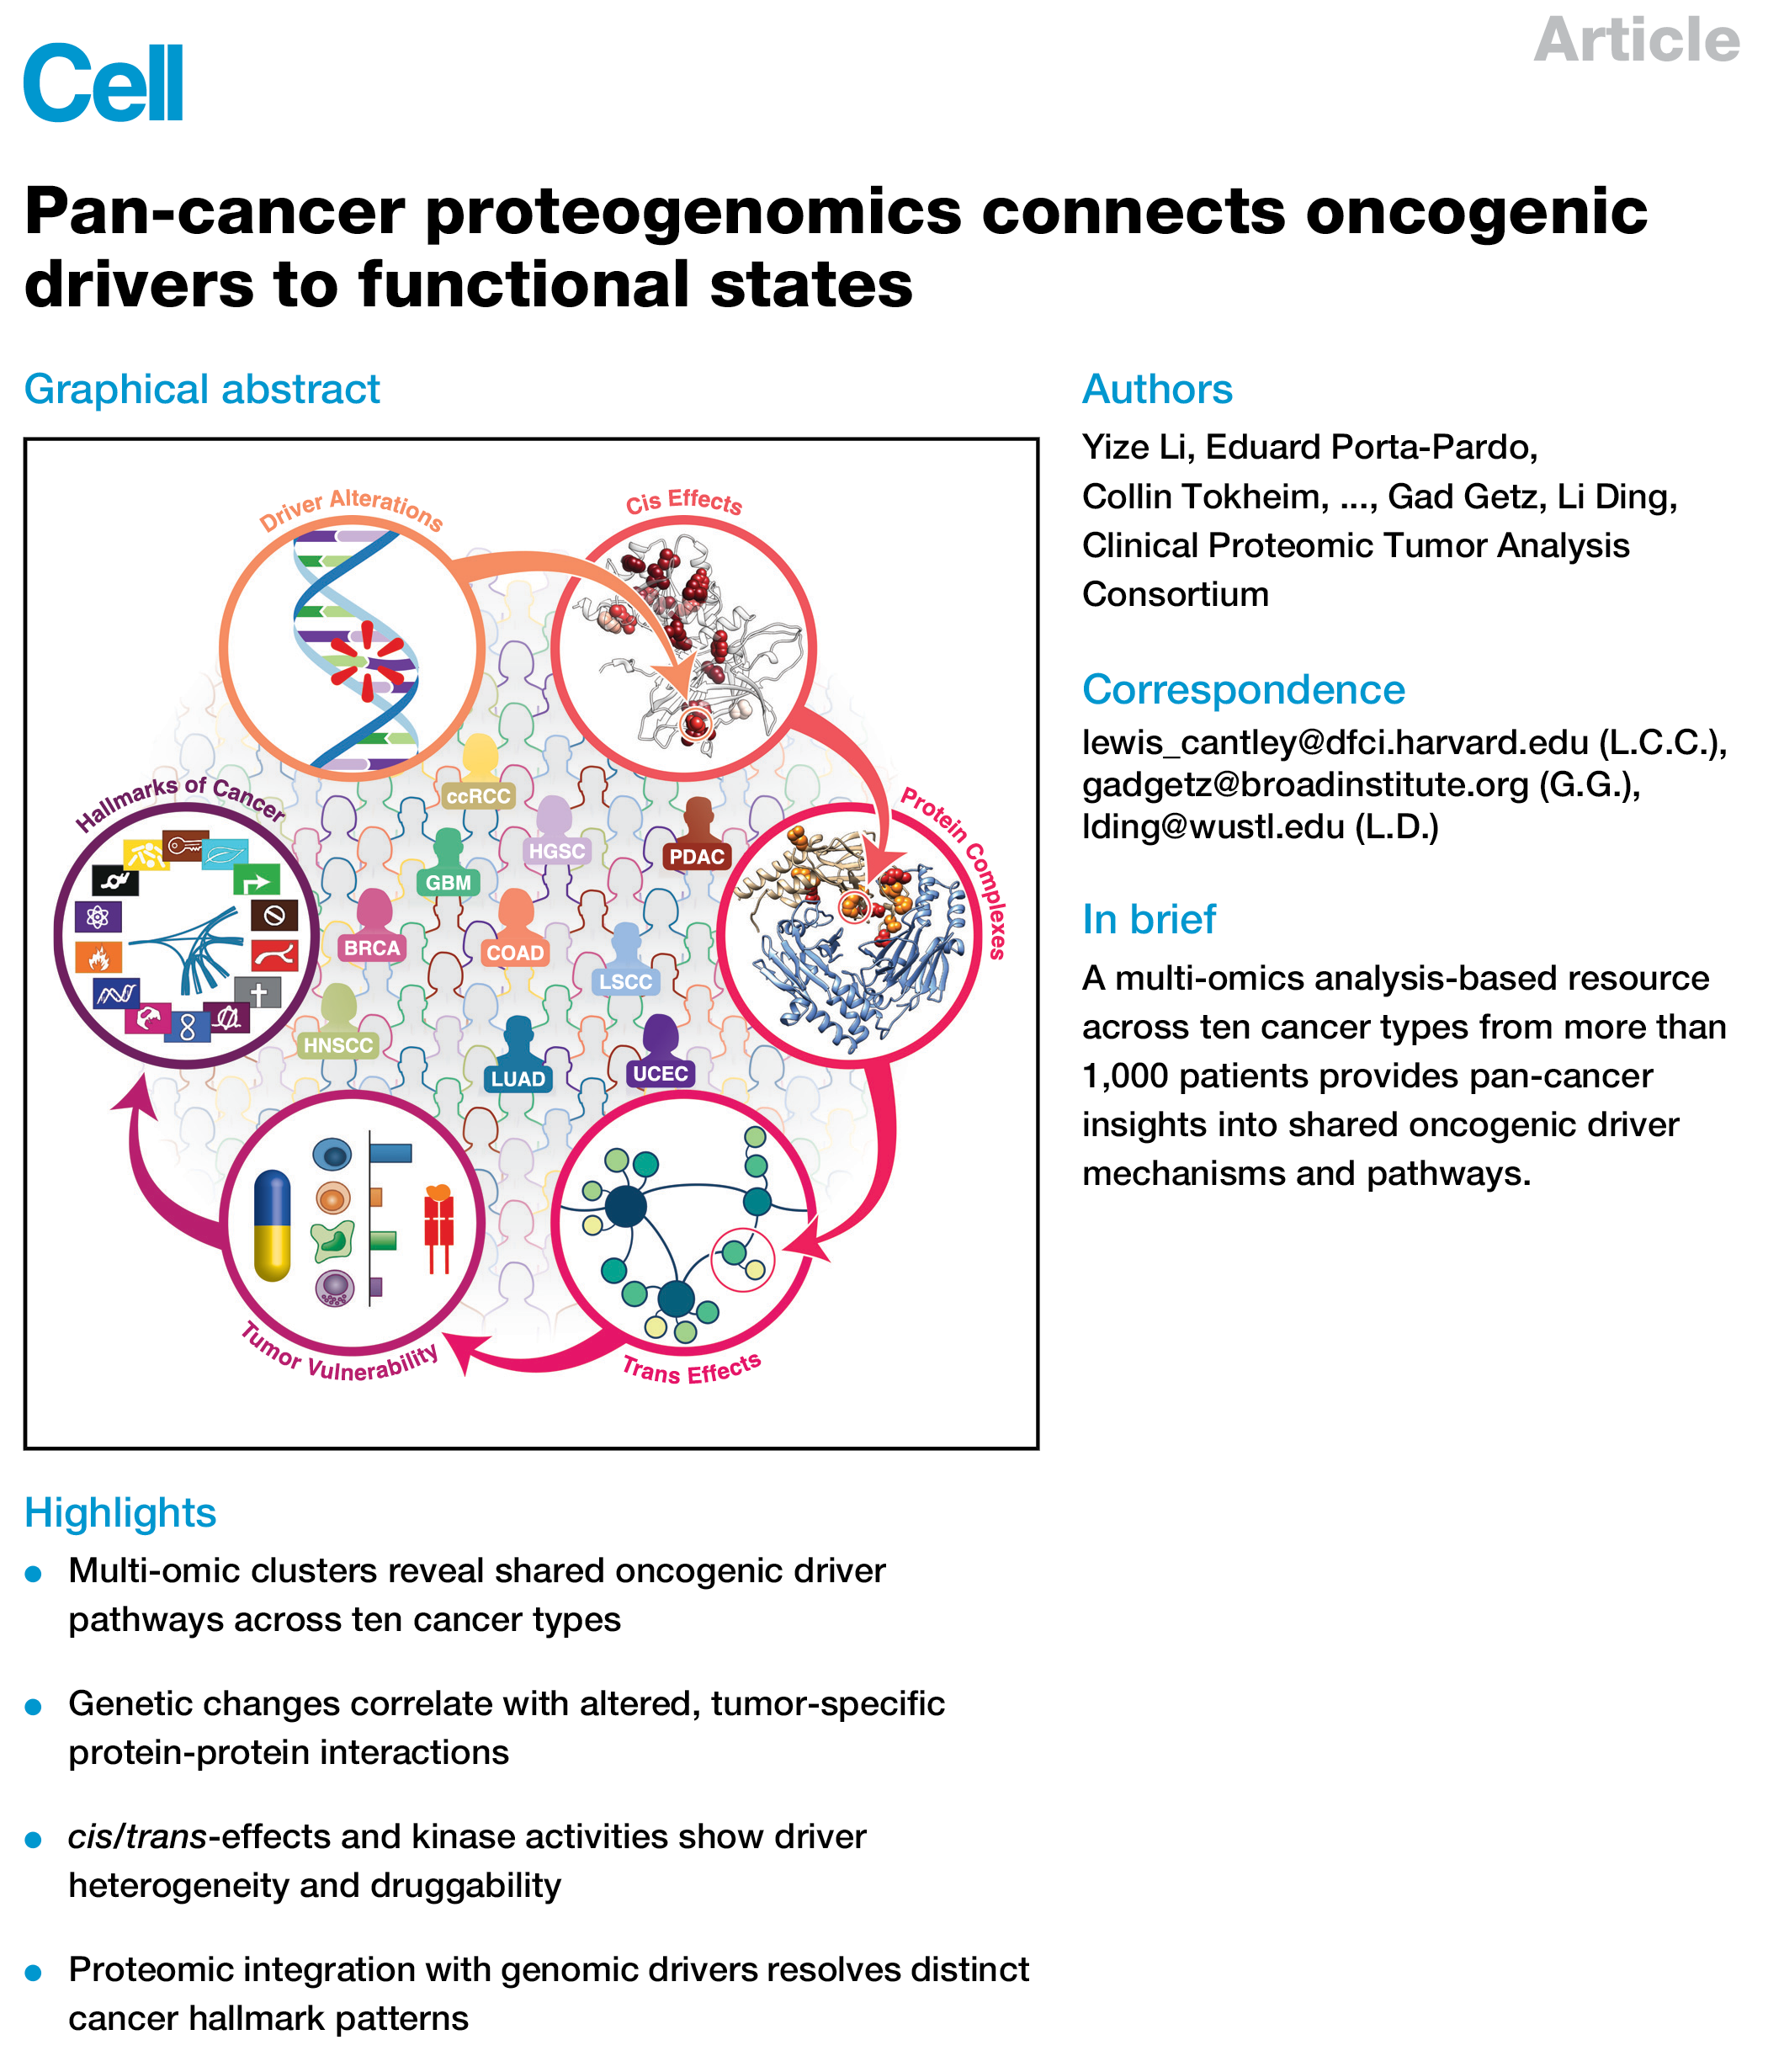
A graphical summary of a manuscript published in Cell, illustrating the multi-scale analysis of ten cancer types to provide insights into mechanisms driving cancer.
Li et al., Pan-cancer proteogenomics connects oncogenic drivers to functional states. Cell, Volume 186, Issue 18, 3921 - 3944.e25 https://www.cell.com/cell/fulltext/S0092-8674(23)00780-8
Summary figure for HTAN Center Grant Application (2018)
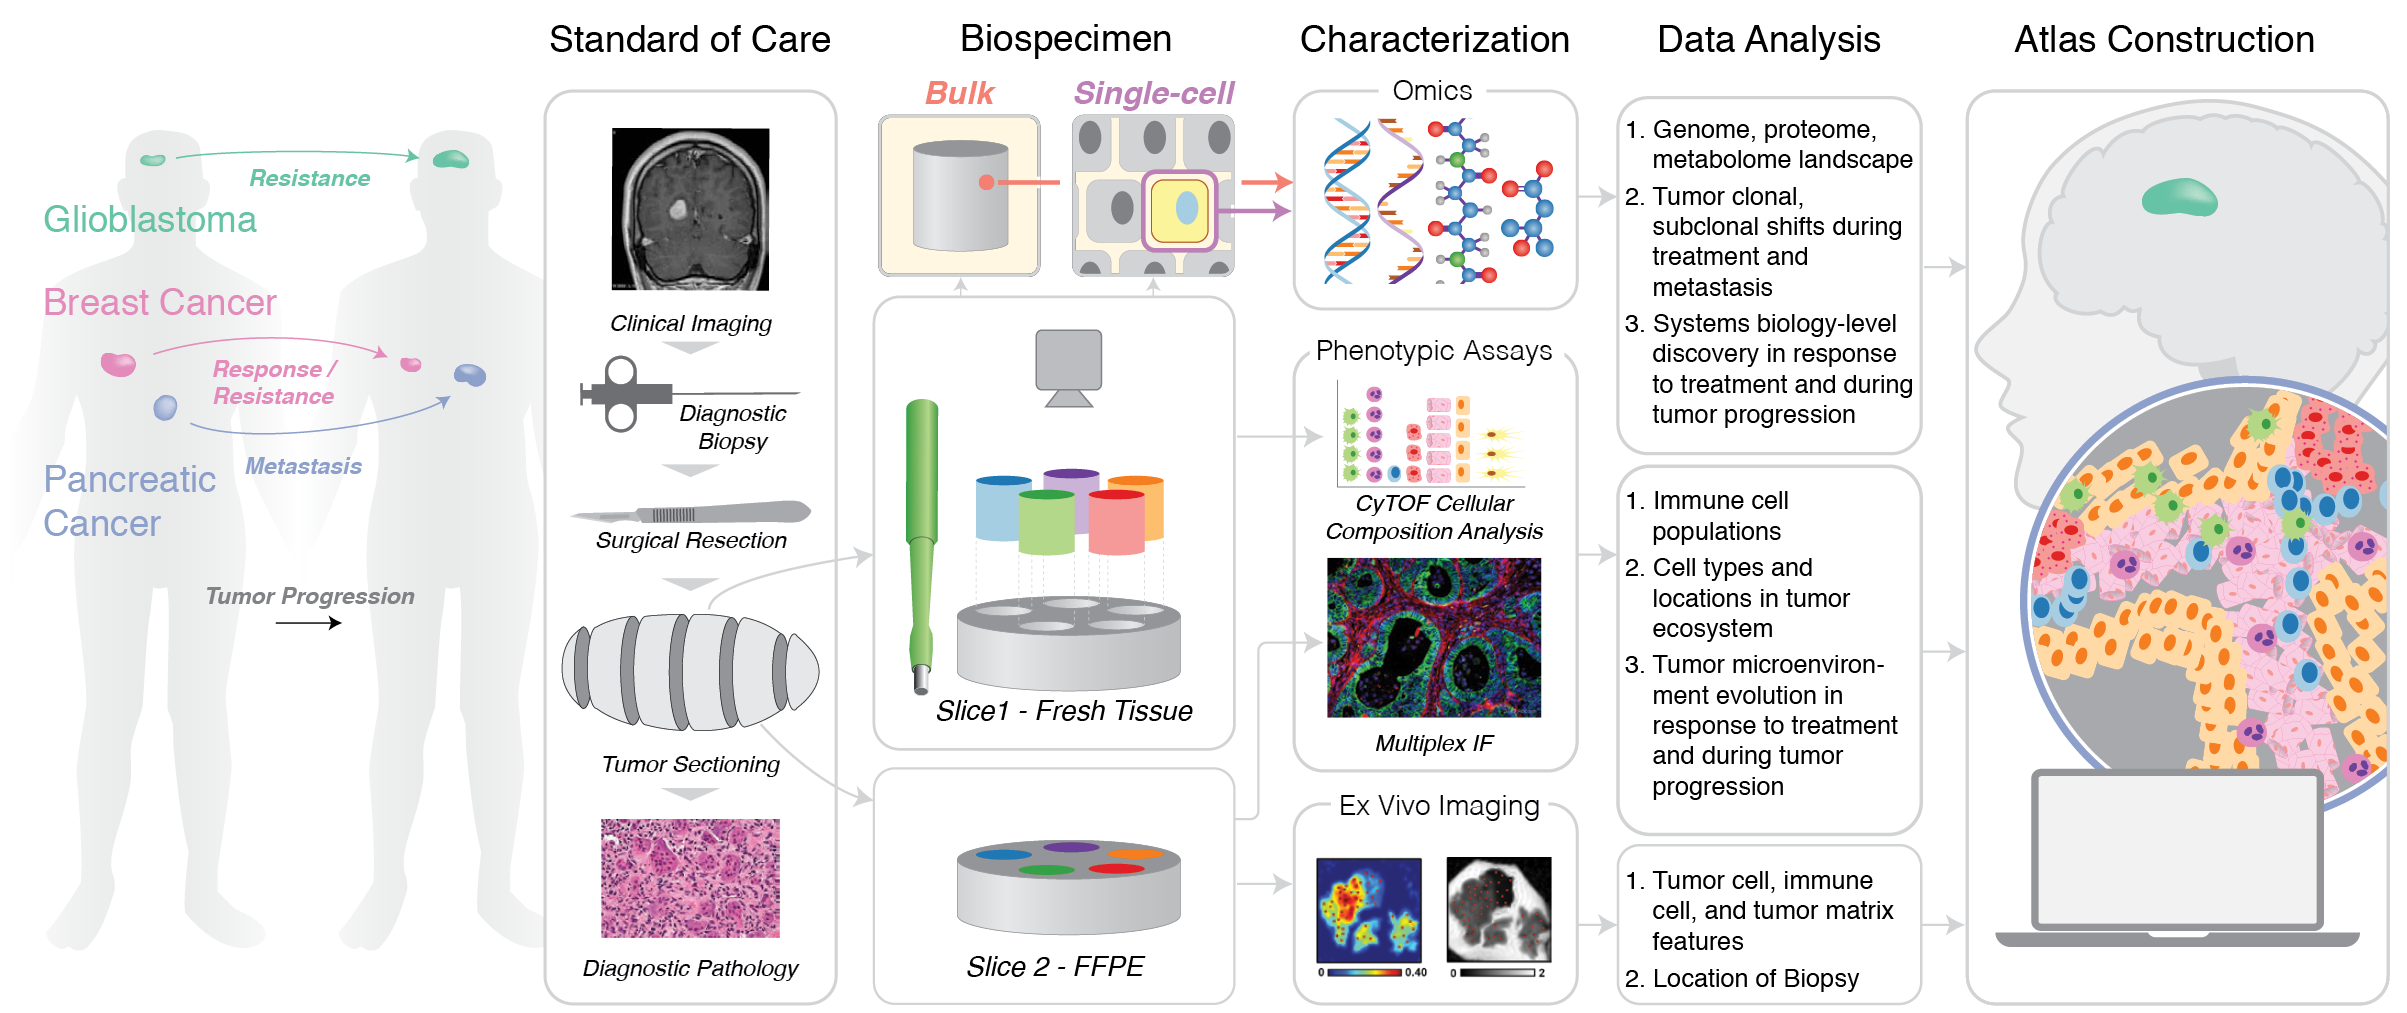
This illustration is the first figure in a grant application for the Human Tumor Atlas Network, providing a visual summary of the aims of the proposal. This successful grant application resulted in a $9.6M award to Washington University (2018-2024).
Visual summary of ML algorithm (2022)
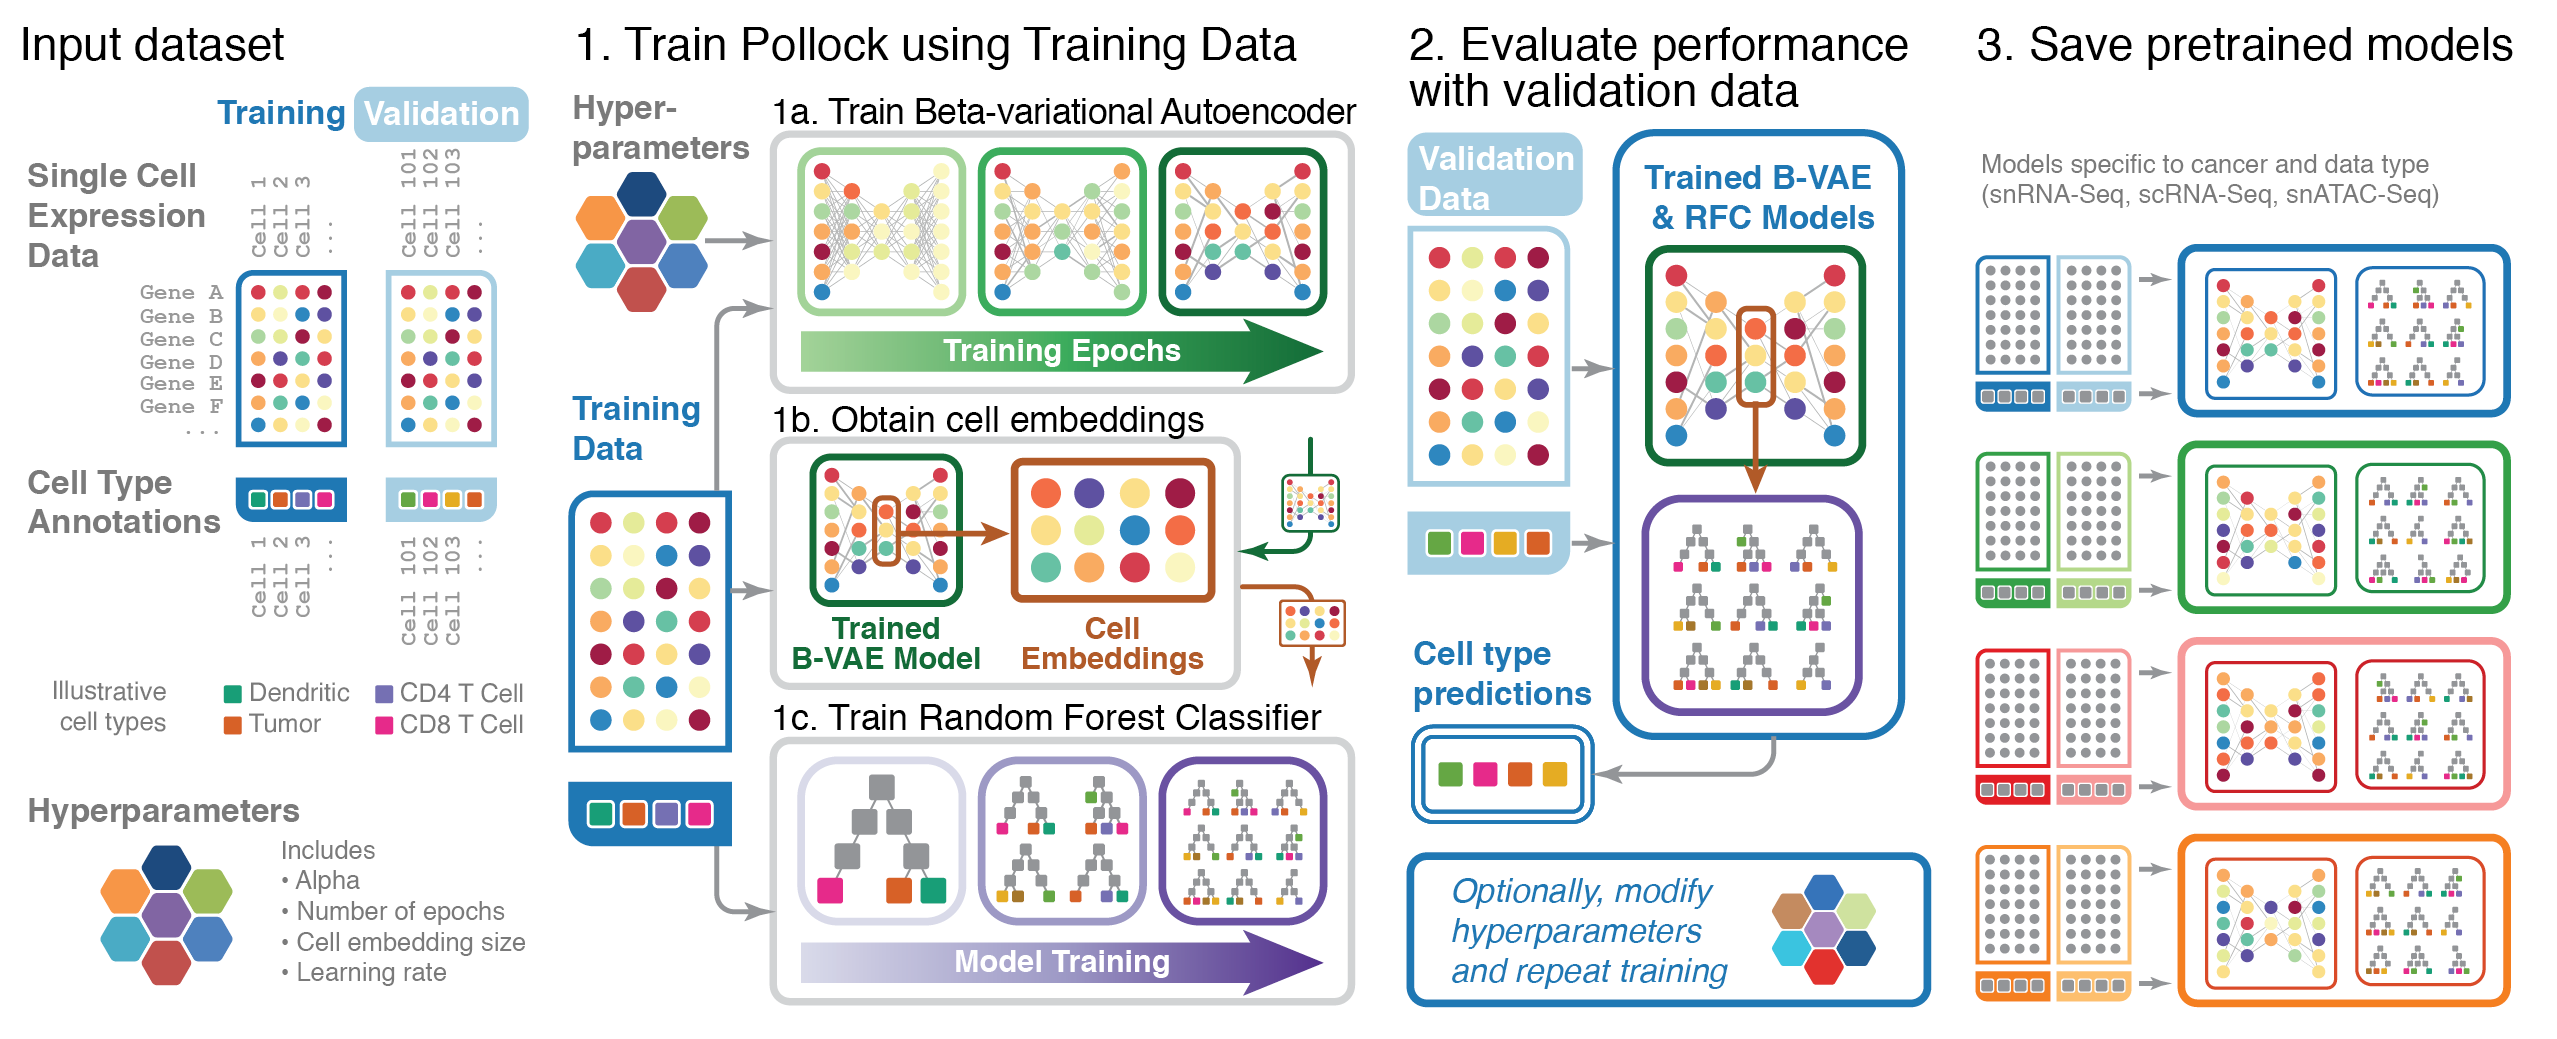
A visual representation of the Machine Learning algorithm underlying the “Pollock” software package for the classification of single cell transcriptome data.
Storrs et al., Pollock: fishing for cell states, Bioinformatics Advances, Volume 2, Issue 1, 2022, vbac028, https://doi.org/10.1093/bioadv/vbac028
Next generation CAR-T cell modifications (2022)
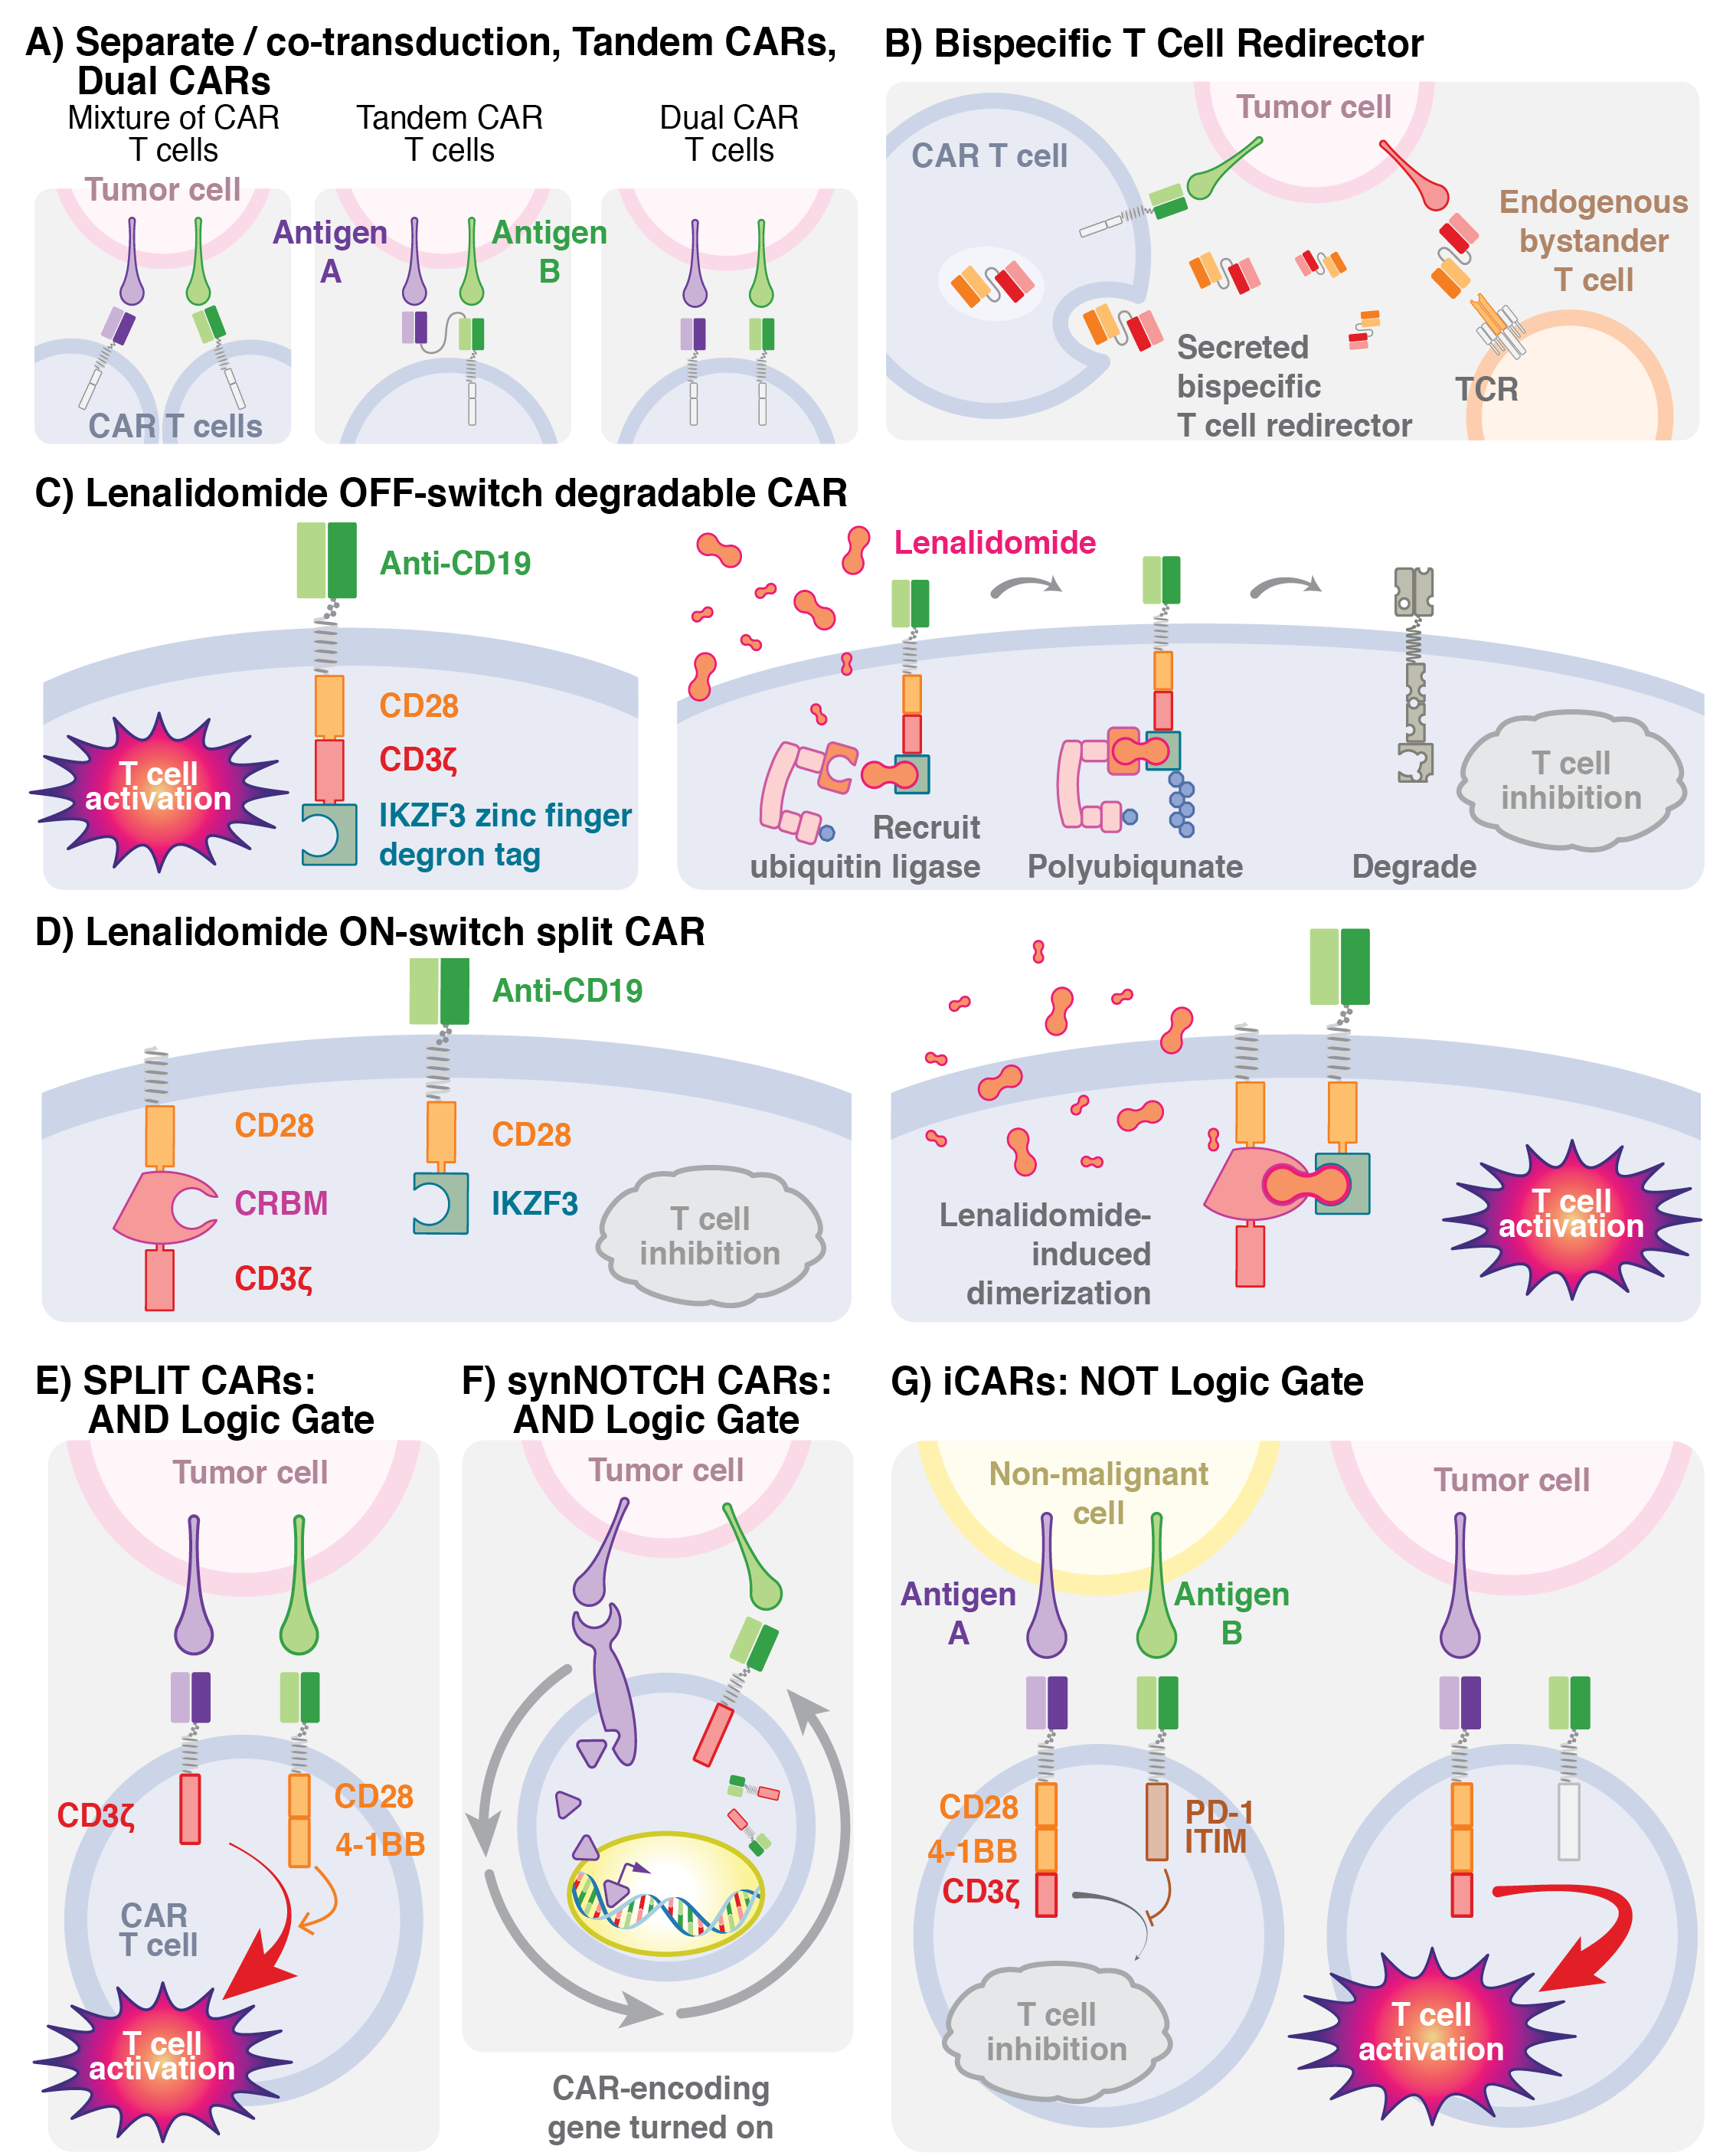
Visual description of a variety of CAR-T technologies associated with cancer immunotherapy, one of a number of figures commissioned for the book, Gene and Cellular Immunotherapy for Cancer.
Ghobadi, A and JF DiPersio. Gene and Cellular Immunotherapy for Cancer. Humana Press, 2022. https://link.springer.com/book/10.1007/978-3-030-87849-8
Key characteristics of cancers learned from TCGA (2021)
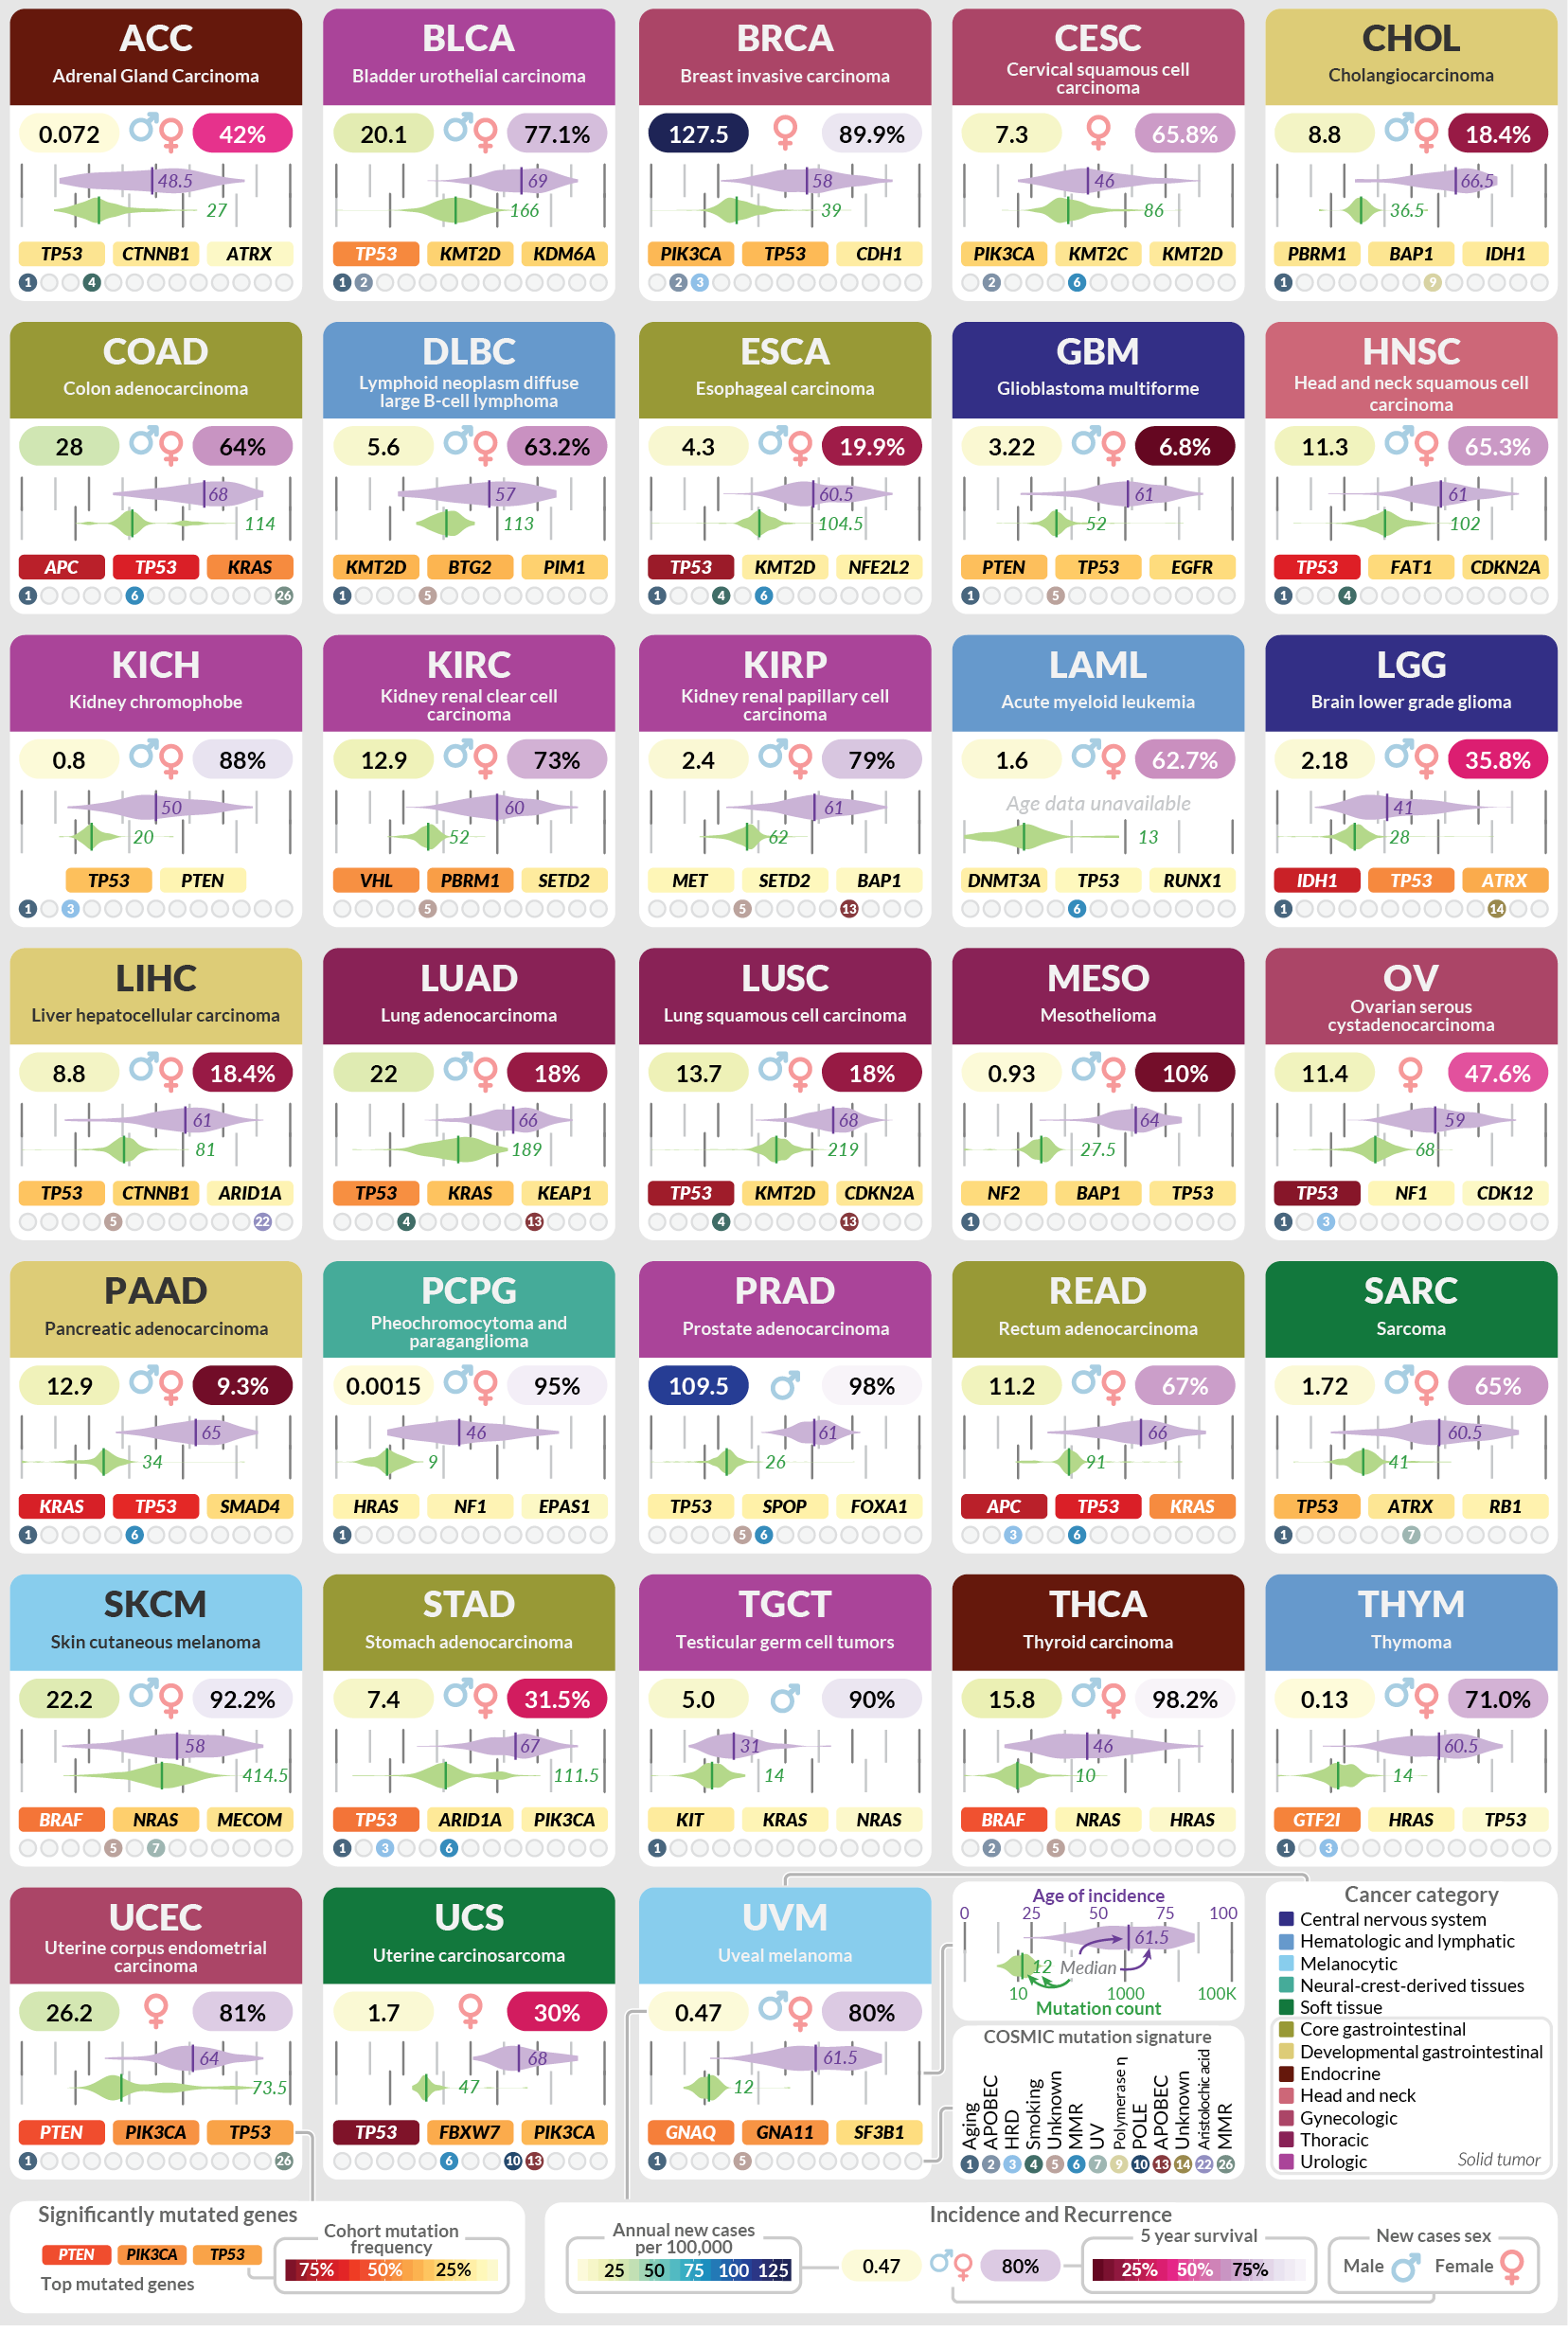
Published as part of a retrospective on the landmark TCGA cancer genomics program, this is a visual representation of the key findings of genomics analyses across 33 cancer types. Each panel provides a concise summary of findings for each cancer, including incidence and survival rates, mutational signatures and associated driver genes.
Chen, F., Wendl, M.C., Wyczalkowski, M.A. et al. Moving pan-cancer studies from basic research toward the clinic. Nat Cancer 2, 879–890 (2021). https://doi.org/10.1038/s43018-021-00250-4
Sample collection plan for PE-CGS grant (2020)
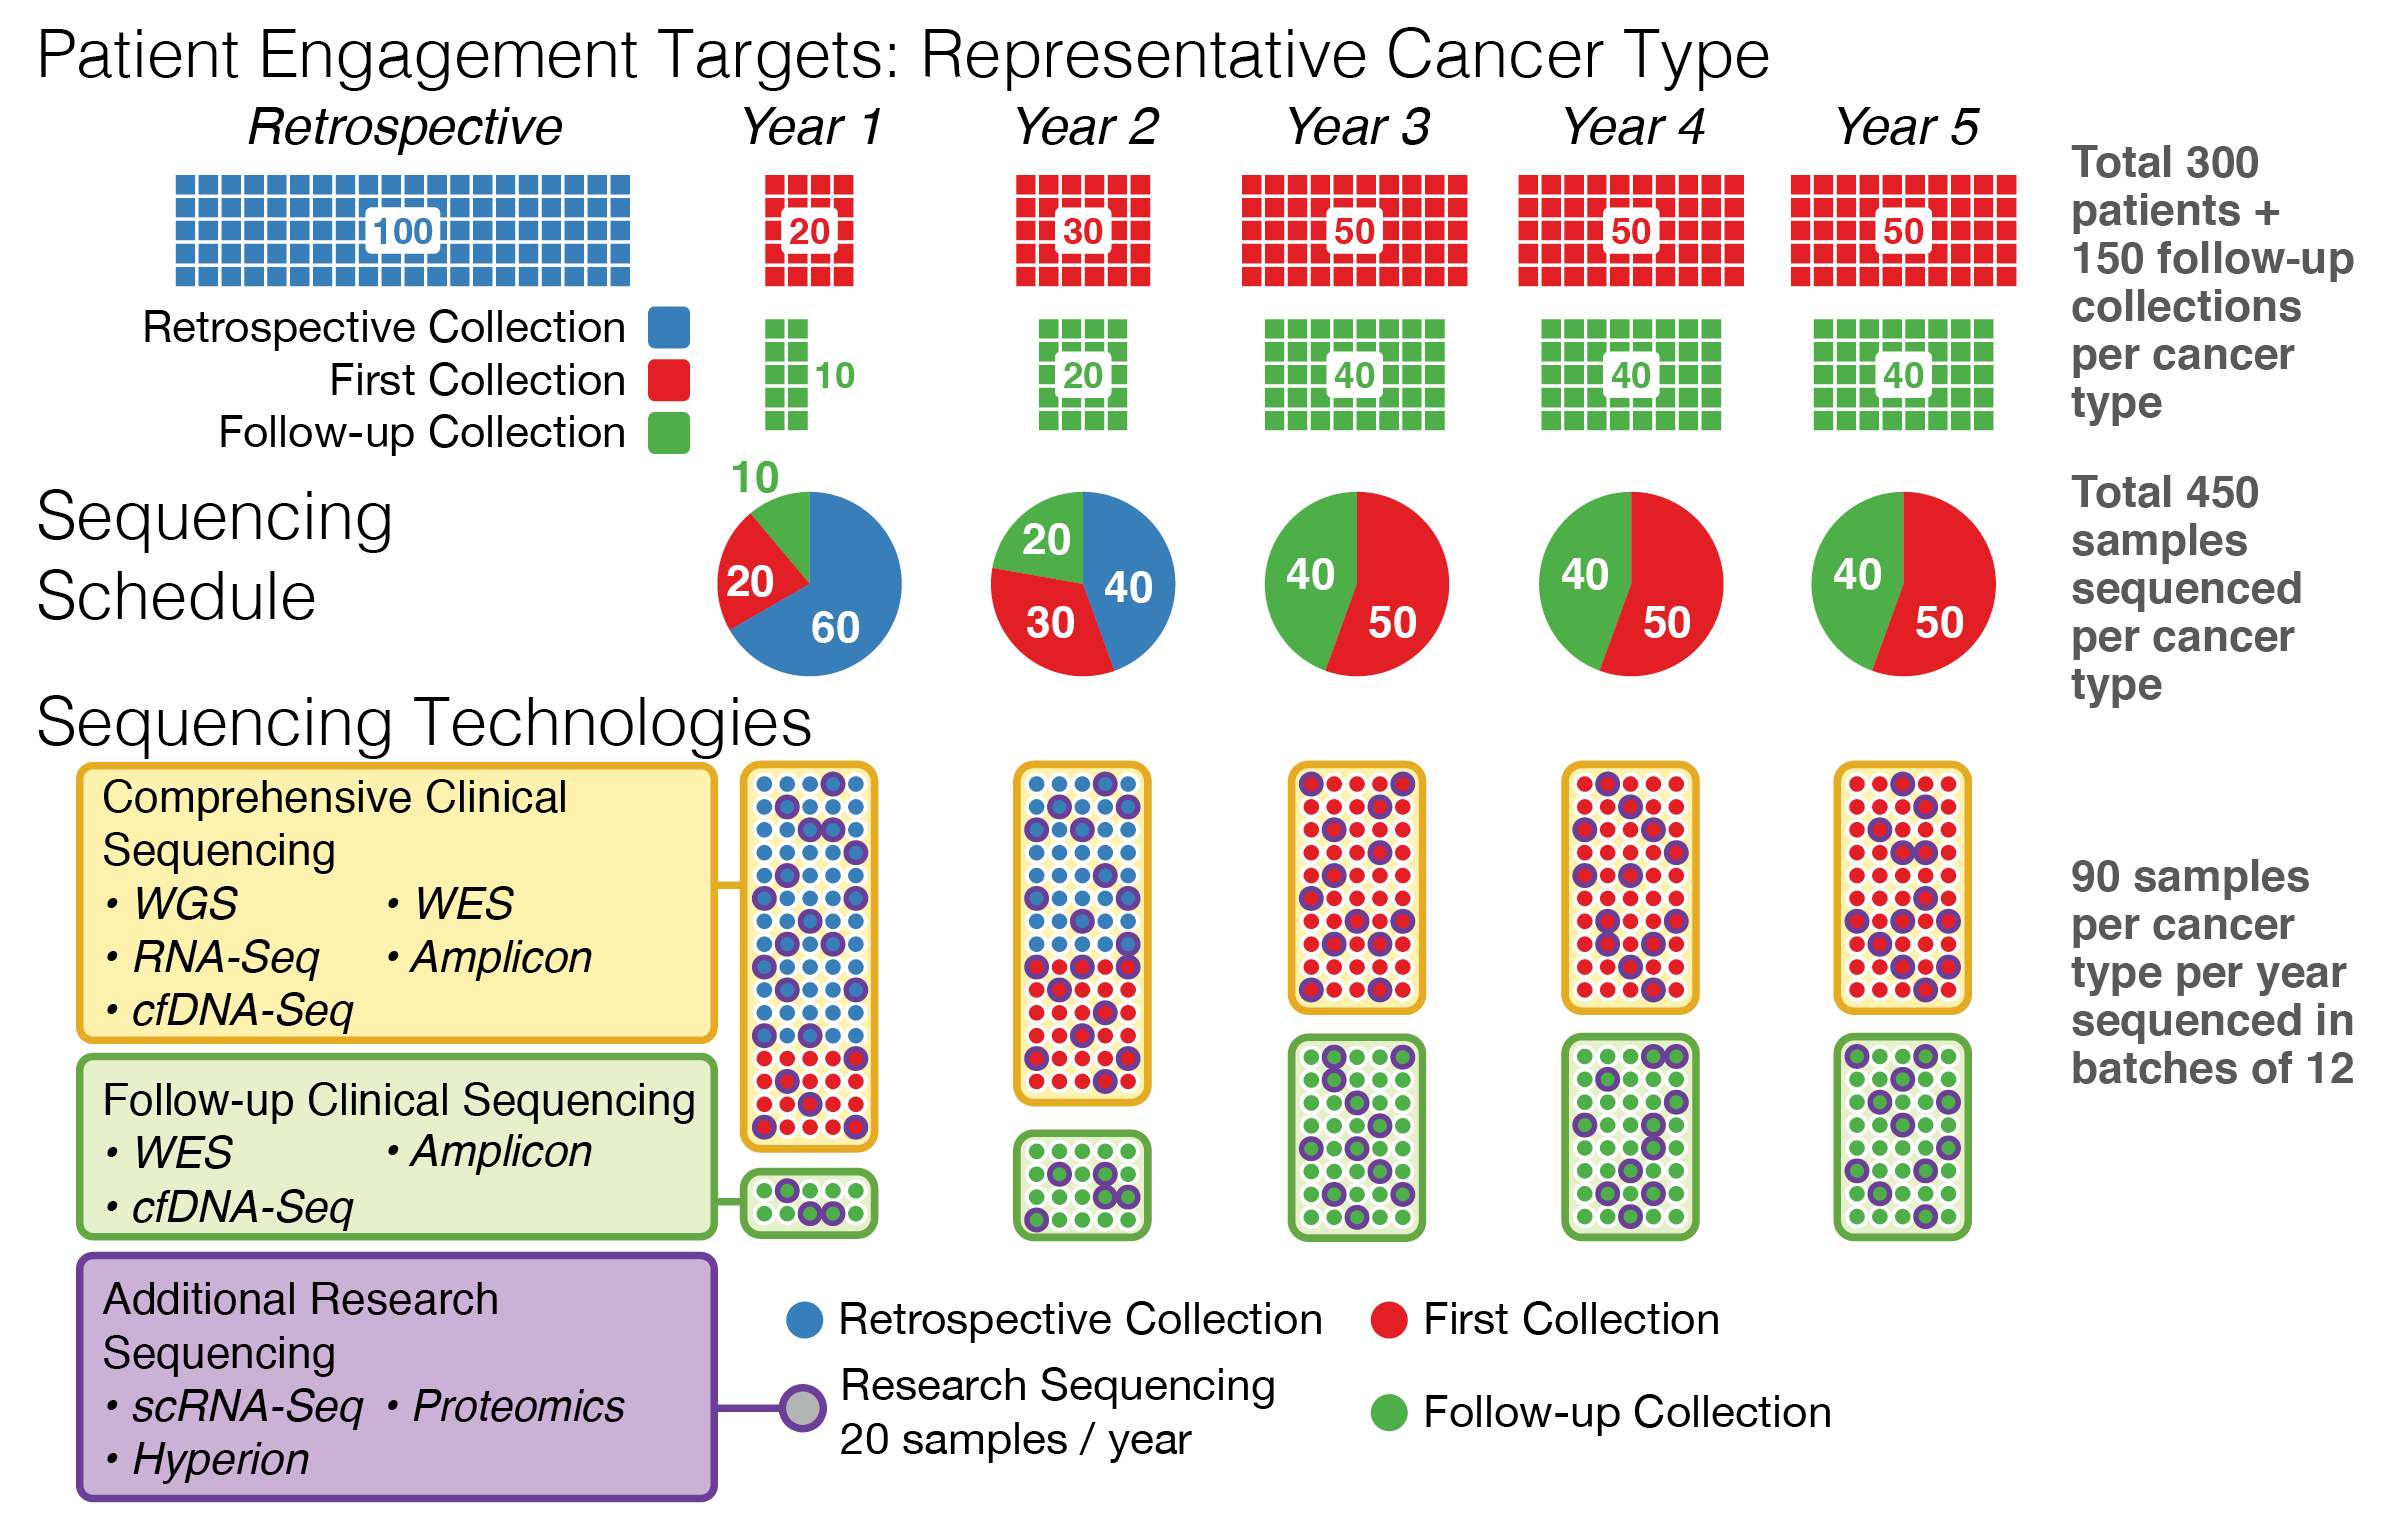
A proposed sample collection and data generation schedule for the PE-CGS grant, illustrating the complex relationship between sample collection from a variety of sources and analysis over time. This figure was part of a successful grant application, resulting in an award to Washigton University of $17.7M (2021-2026).
Therapeutic targets and treatment responses across cancer types (2021)
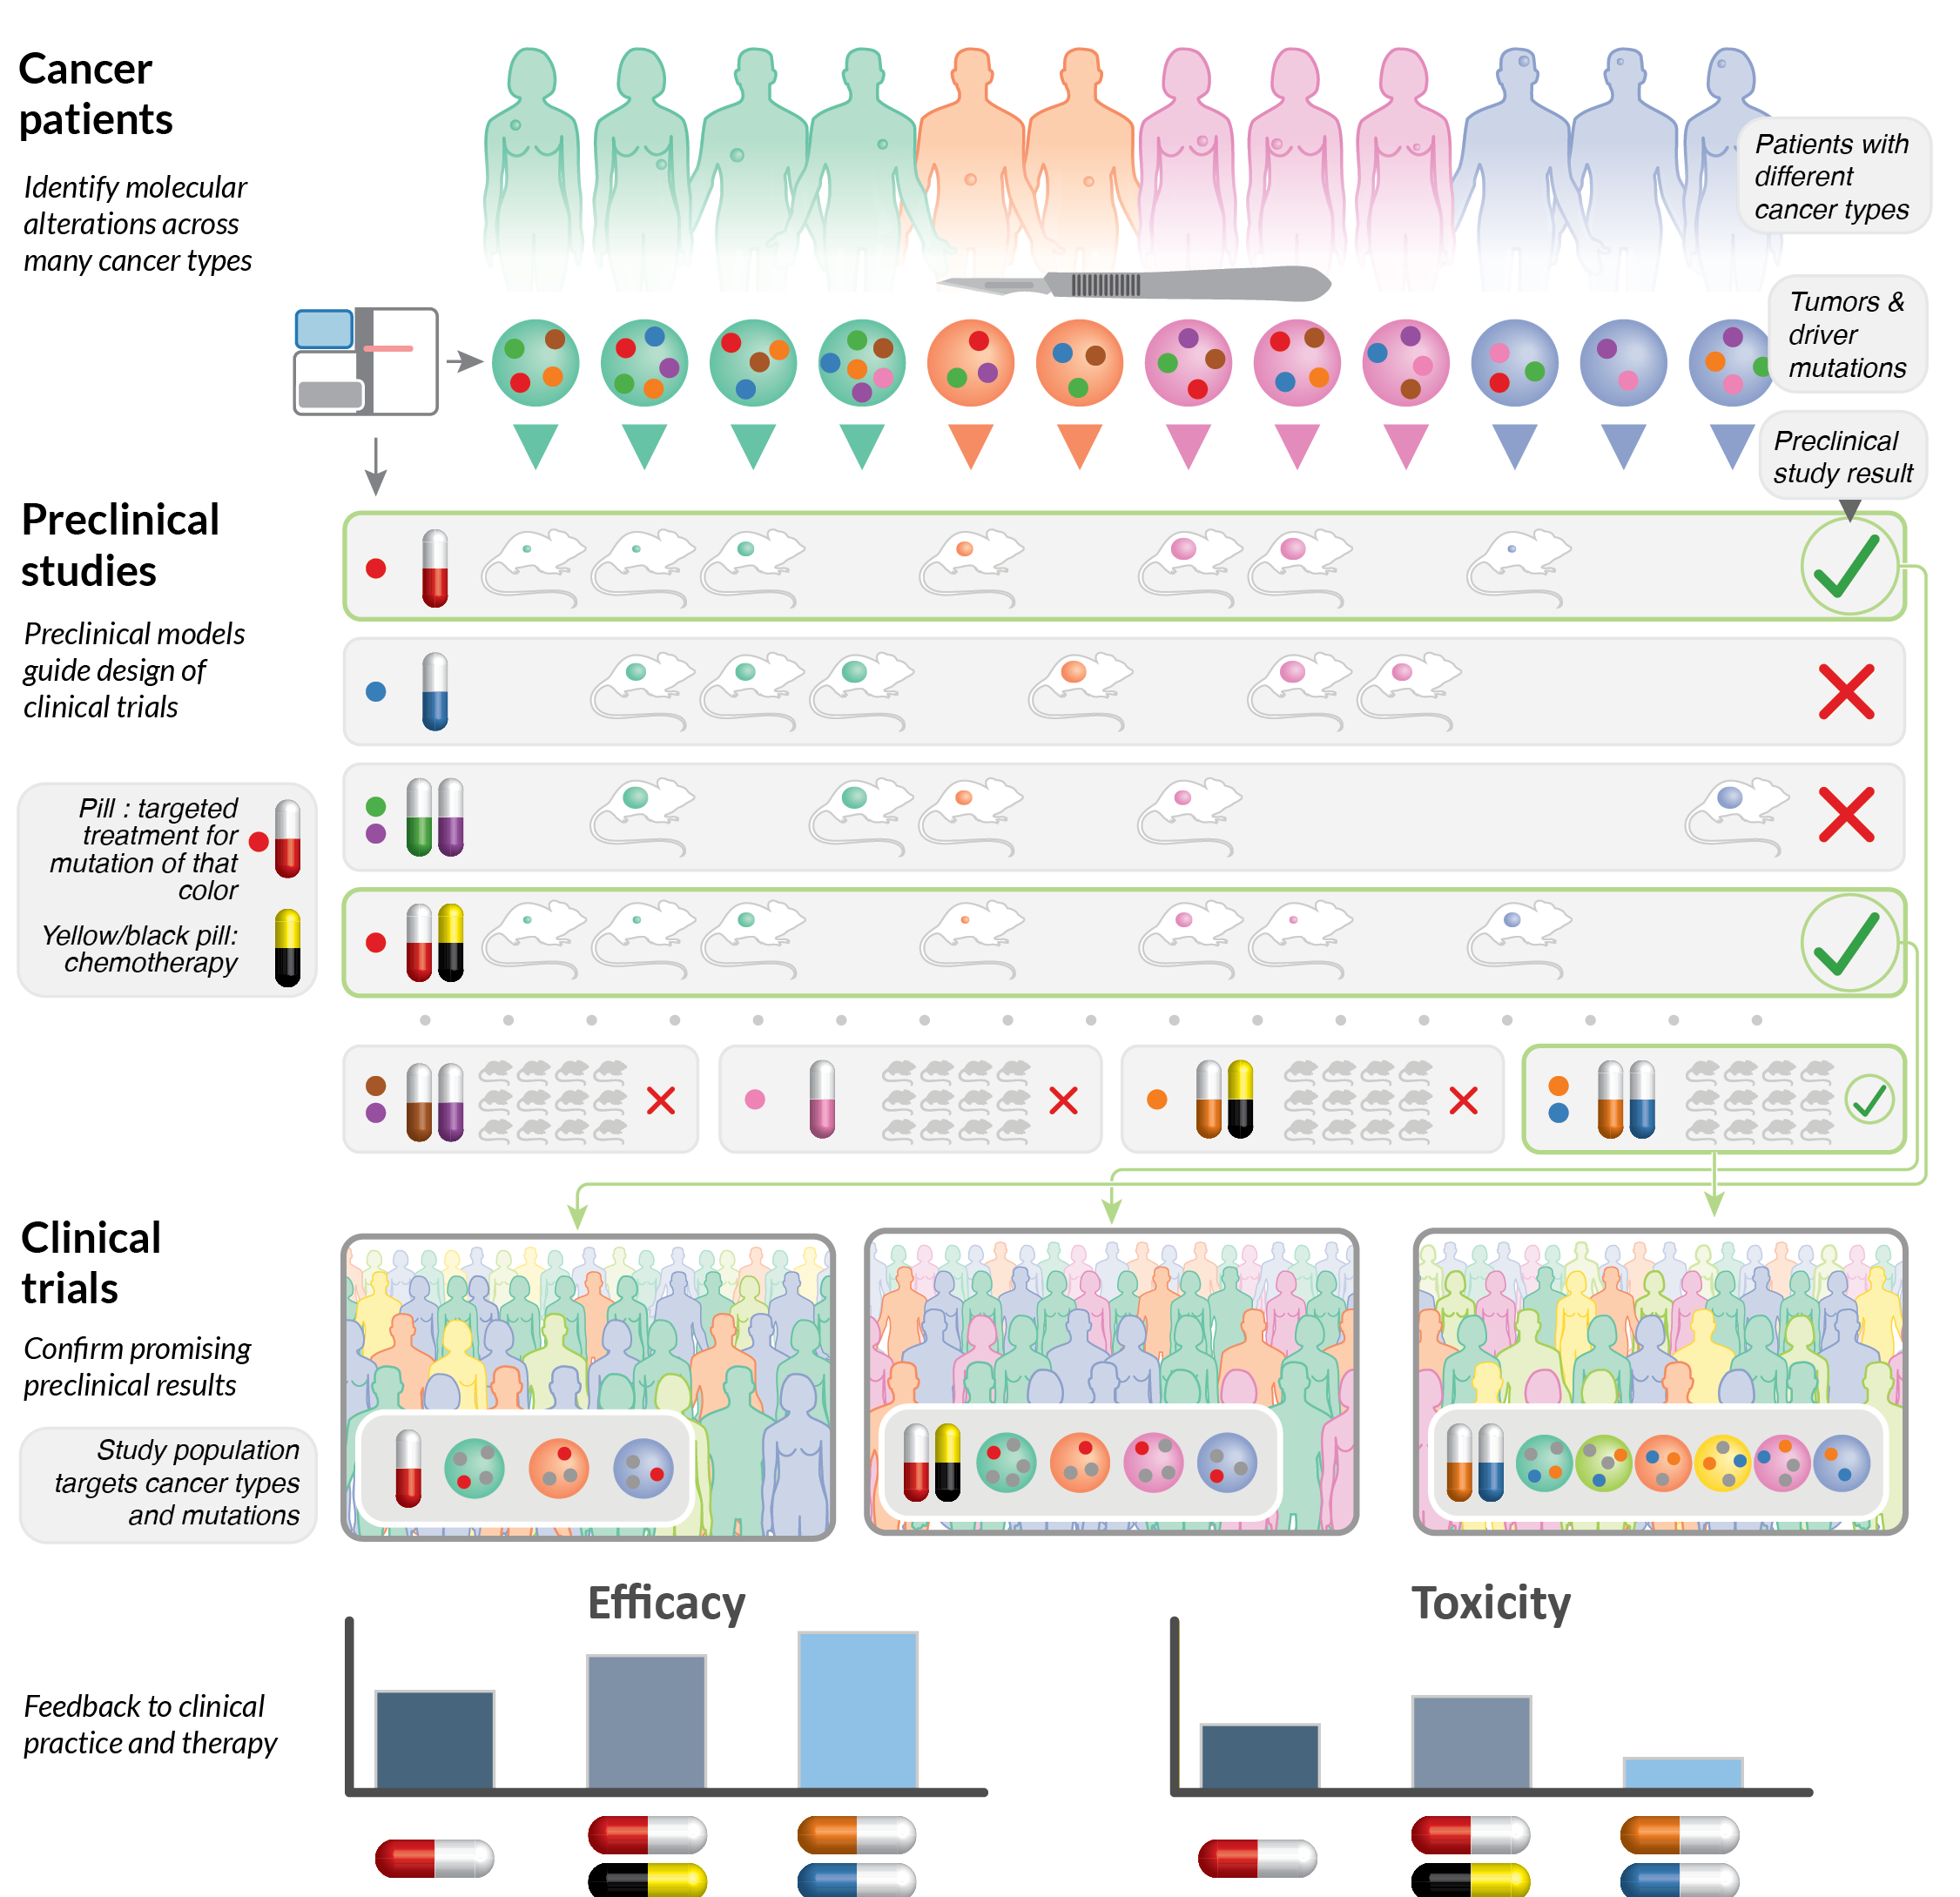
Illustration of a strategy for preclinical studies and clinical trials based on molecular features.
Chen, F., Wendl, M.C., Wyczalkowski, M.A. et al. Moving pan-cancer studies from basic research toward the clinic. Nat Cancer 2, 879–890 (2021). https://doi.org/10.1038/s43018-021-00250-4
HTAN data collection at multiple scales (2024)
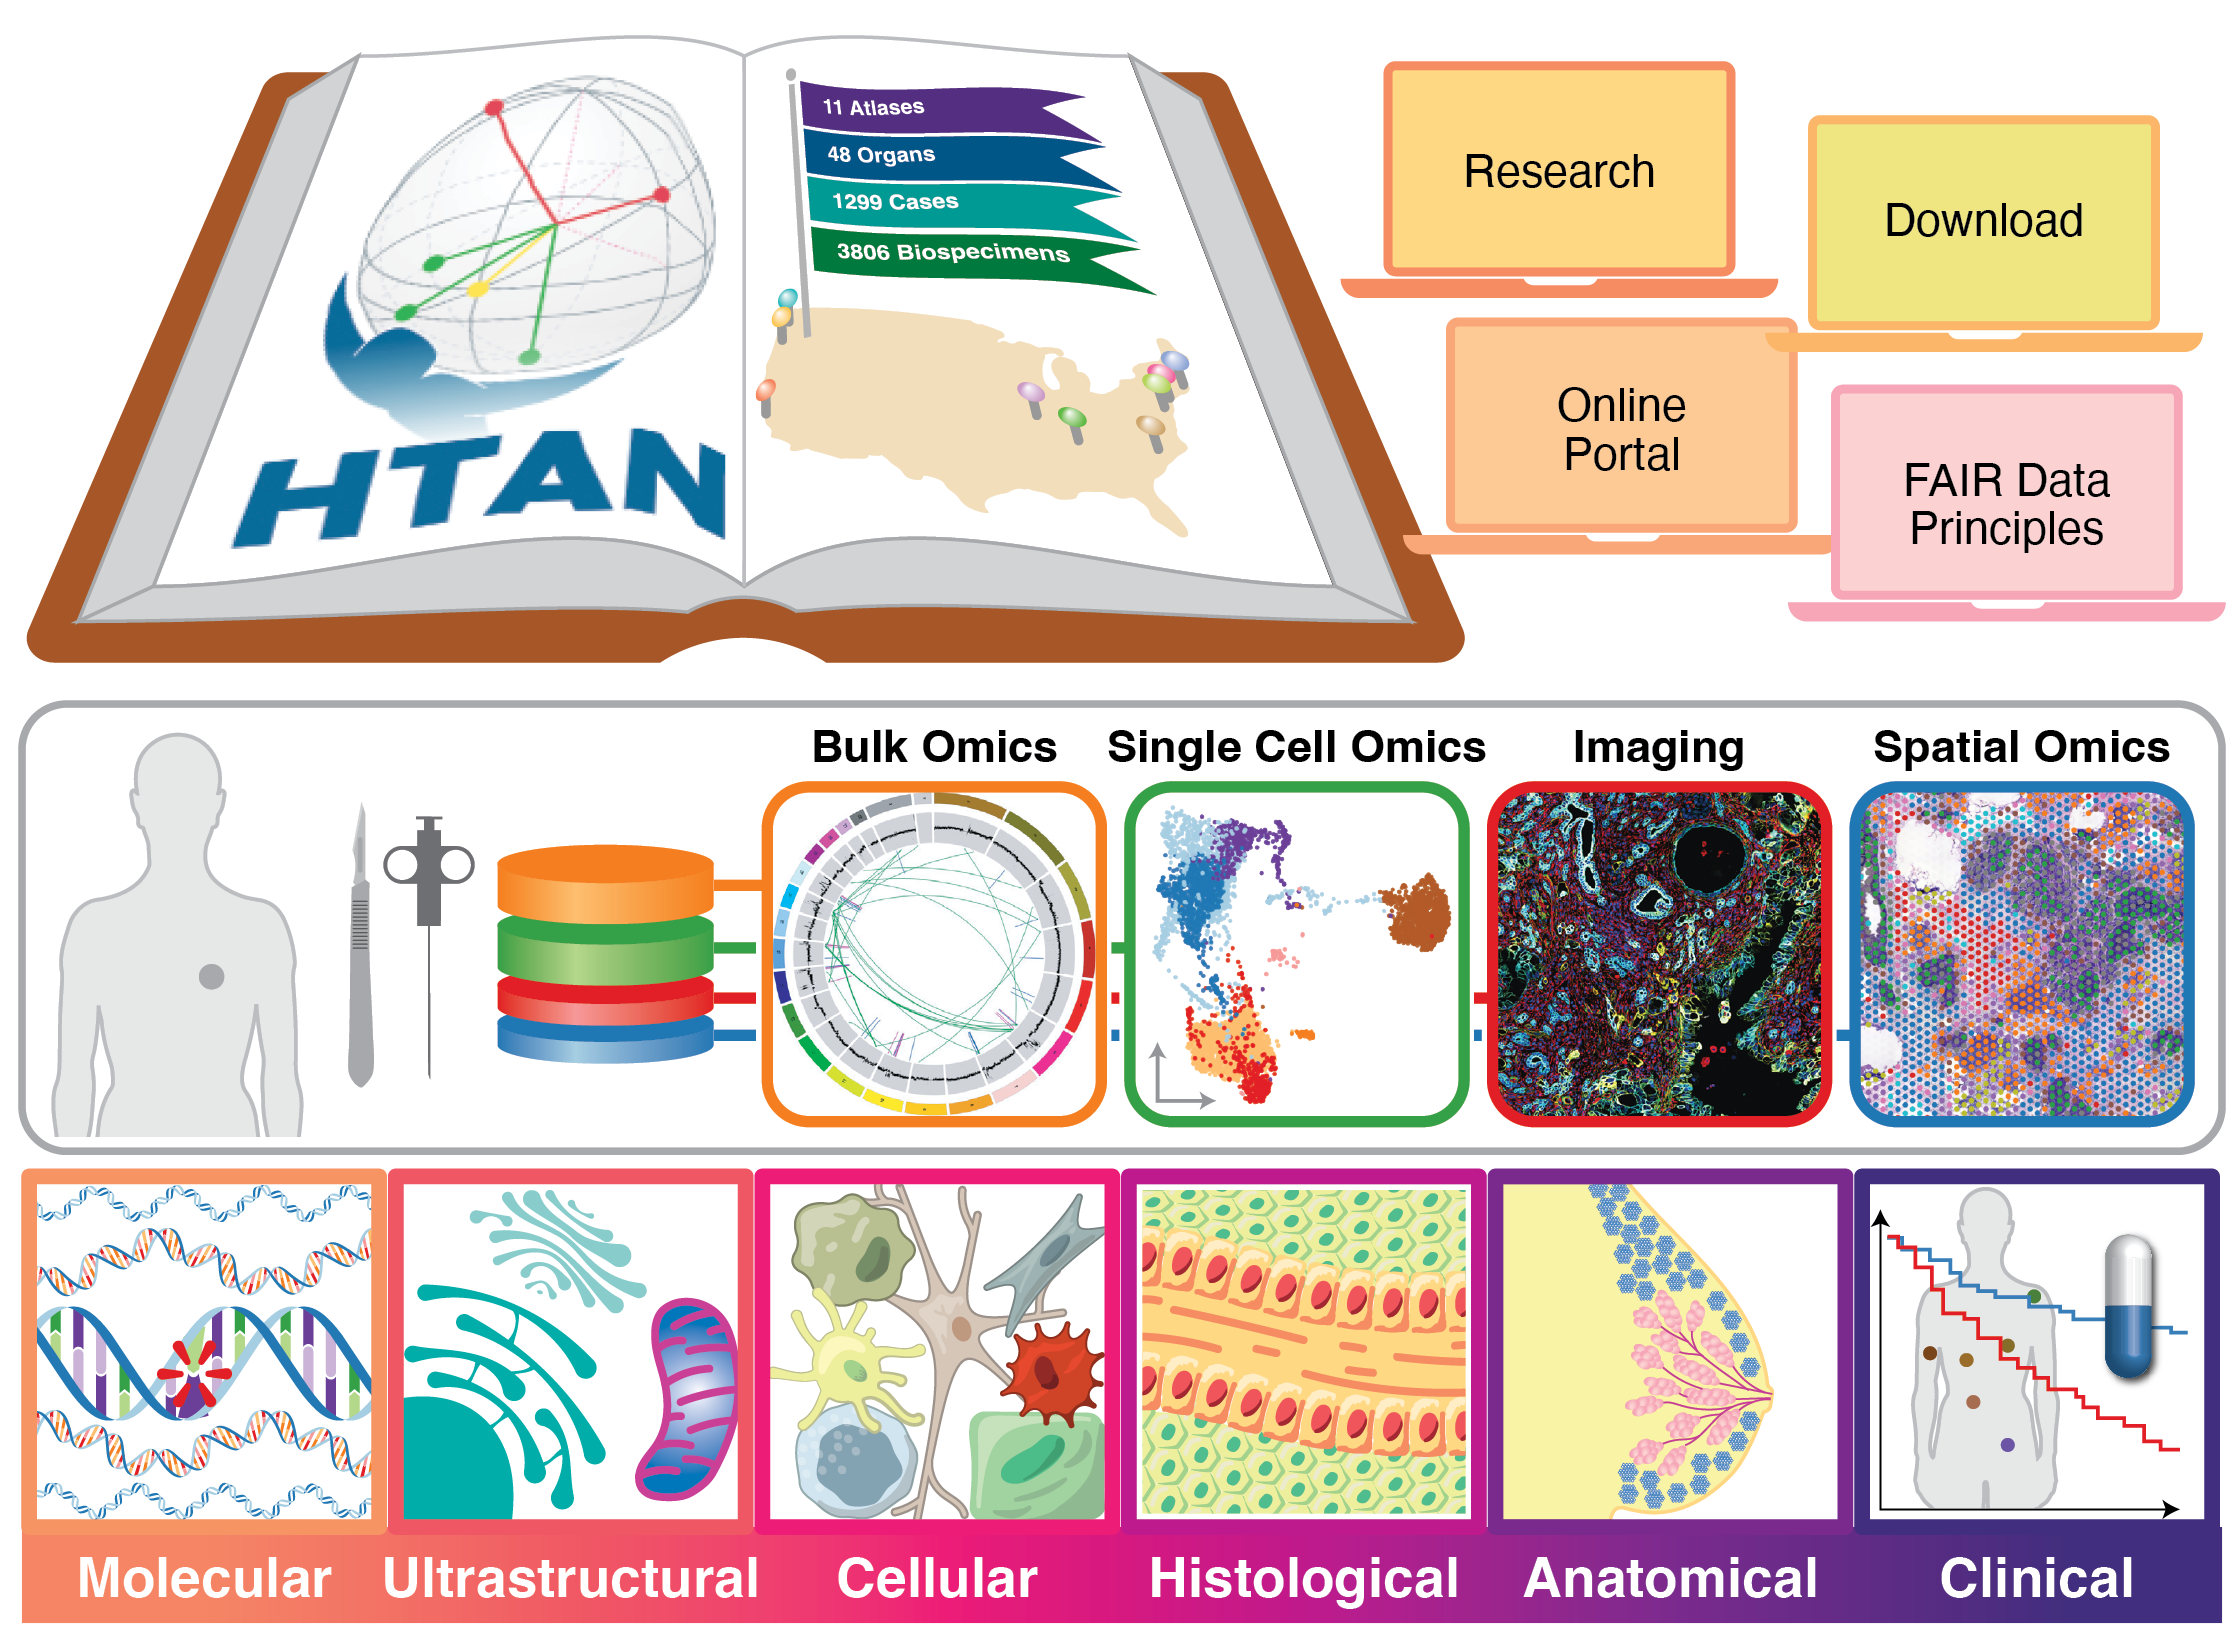
Visual representation of data collection across spatial scales for the HTAN project. A version of this illustration was published as part of a Nature special feature on the Human Tumor Atlas Network: https://www.nature.com/immersive/d42859-024-00059-y/index.html
Genetic mutations across cancer types (2013)
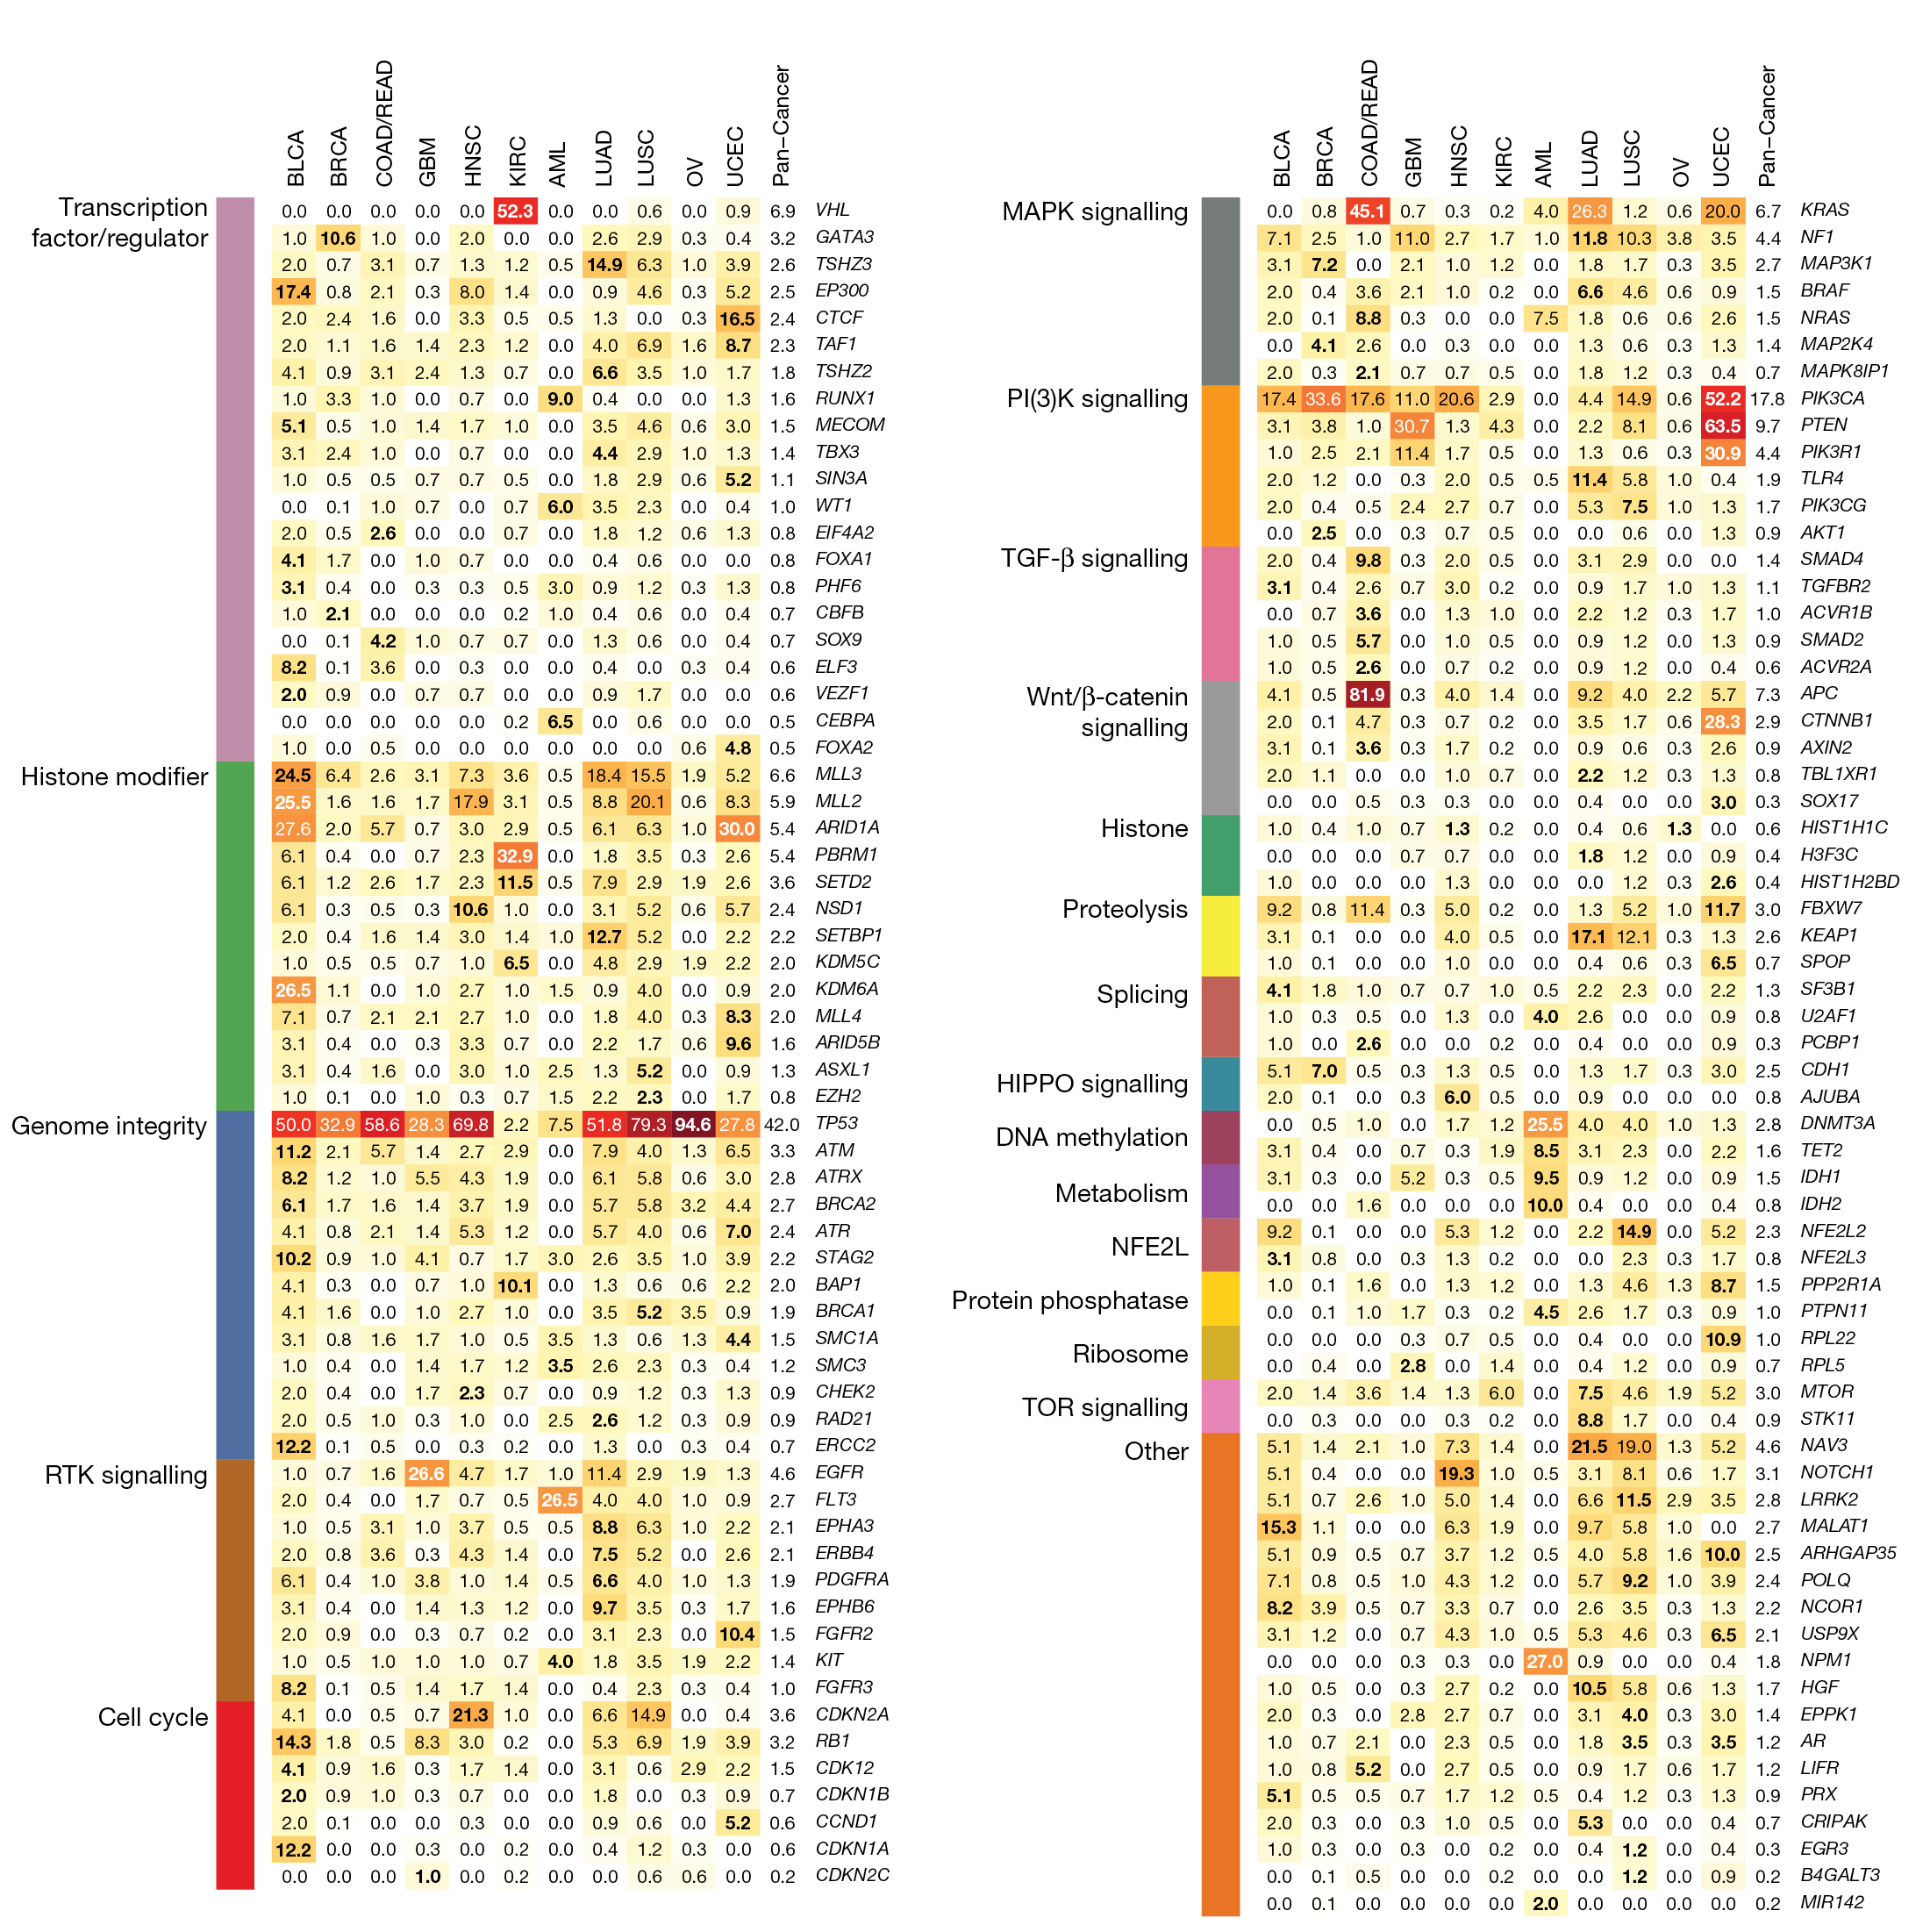
Key figure in a landmark paper published in Nature illustrating patterns of genetic mutations across cancer types.
Kandoth, C., McLellan, M., Vandin, F. et al. Mutational landscape and significance across 12 major cancer types. Nature 502, 333–339 (2013). https://doi.org/10.1038/nature12634
Collection protocol and naming scheme for HTAN2 grant application (2024)
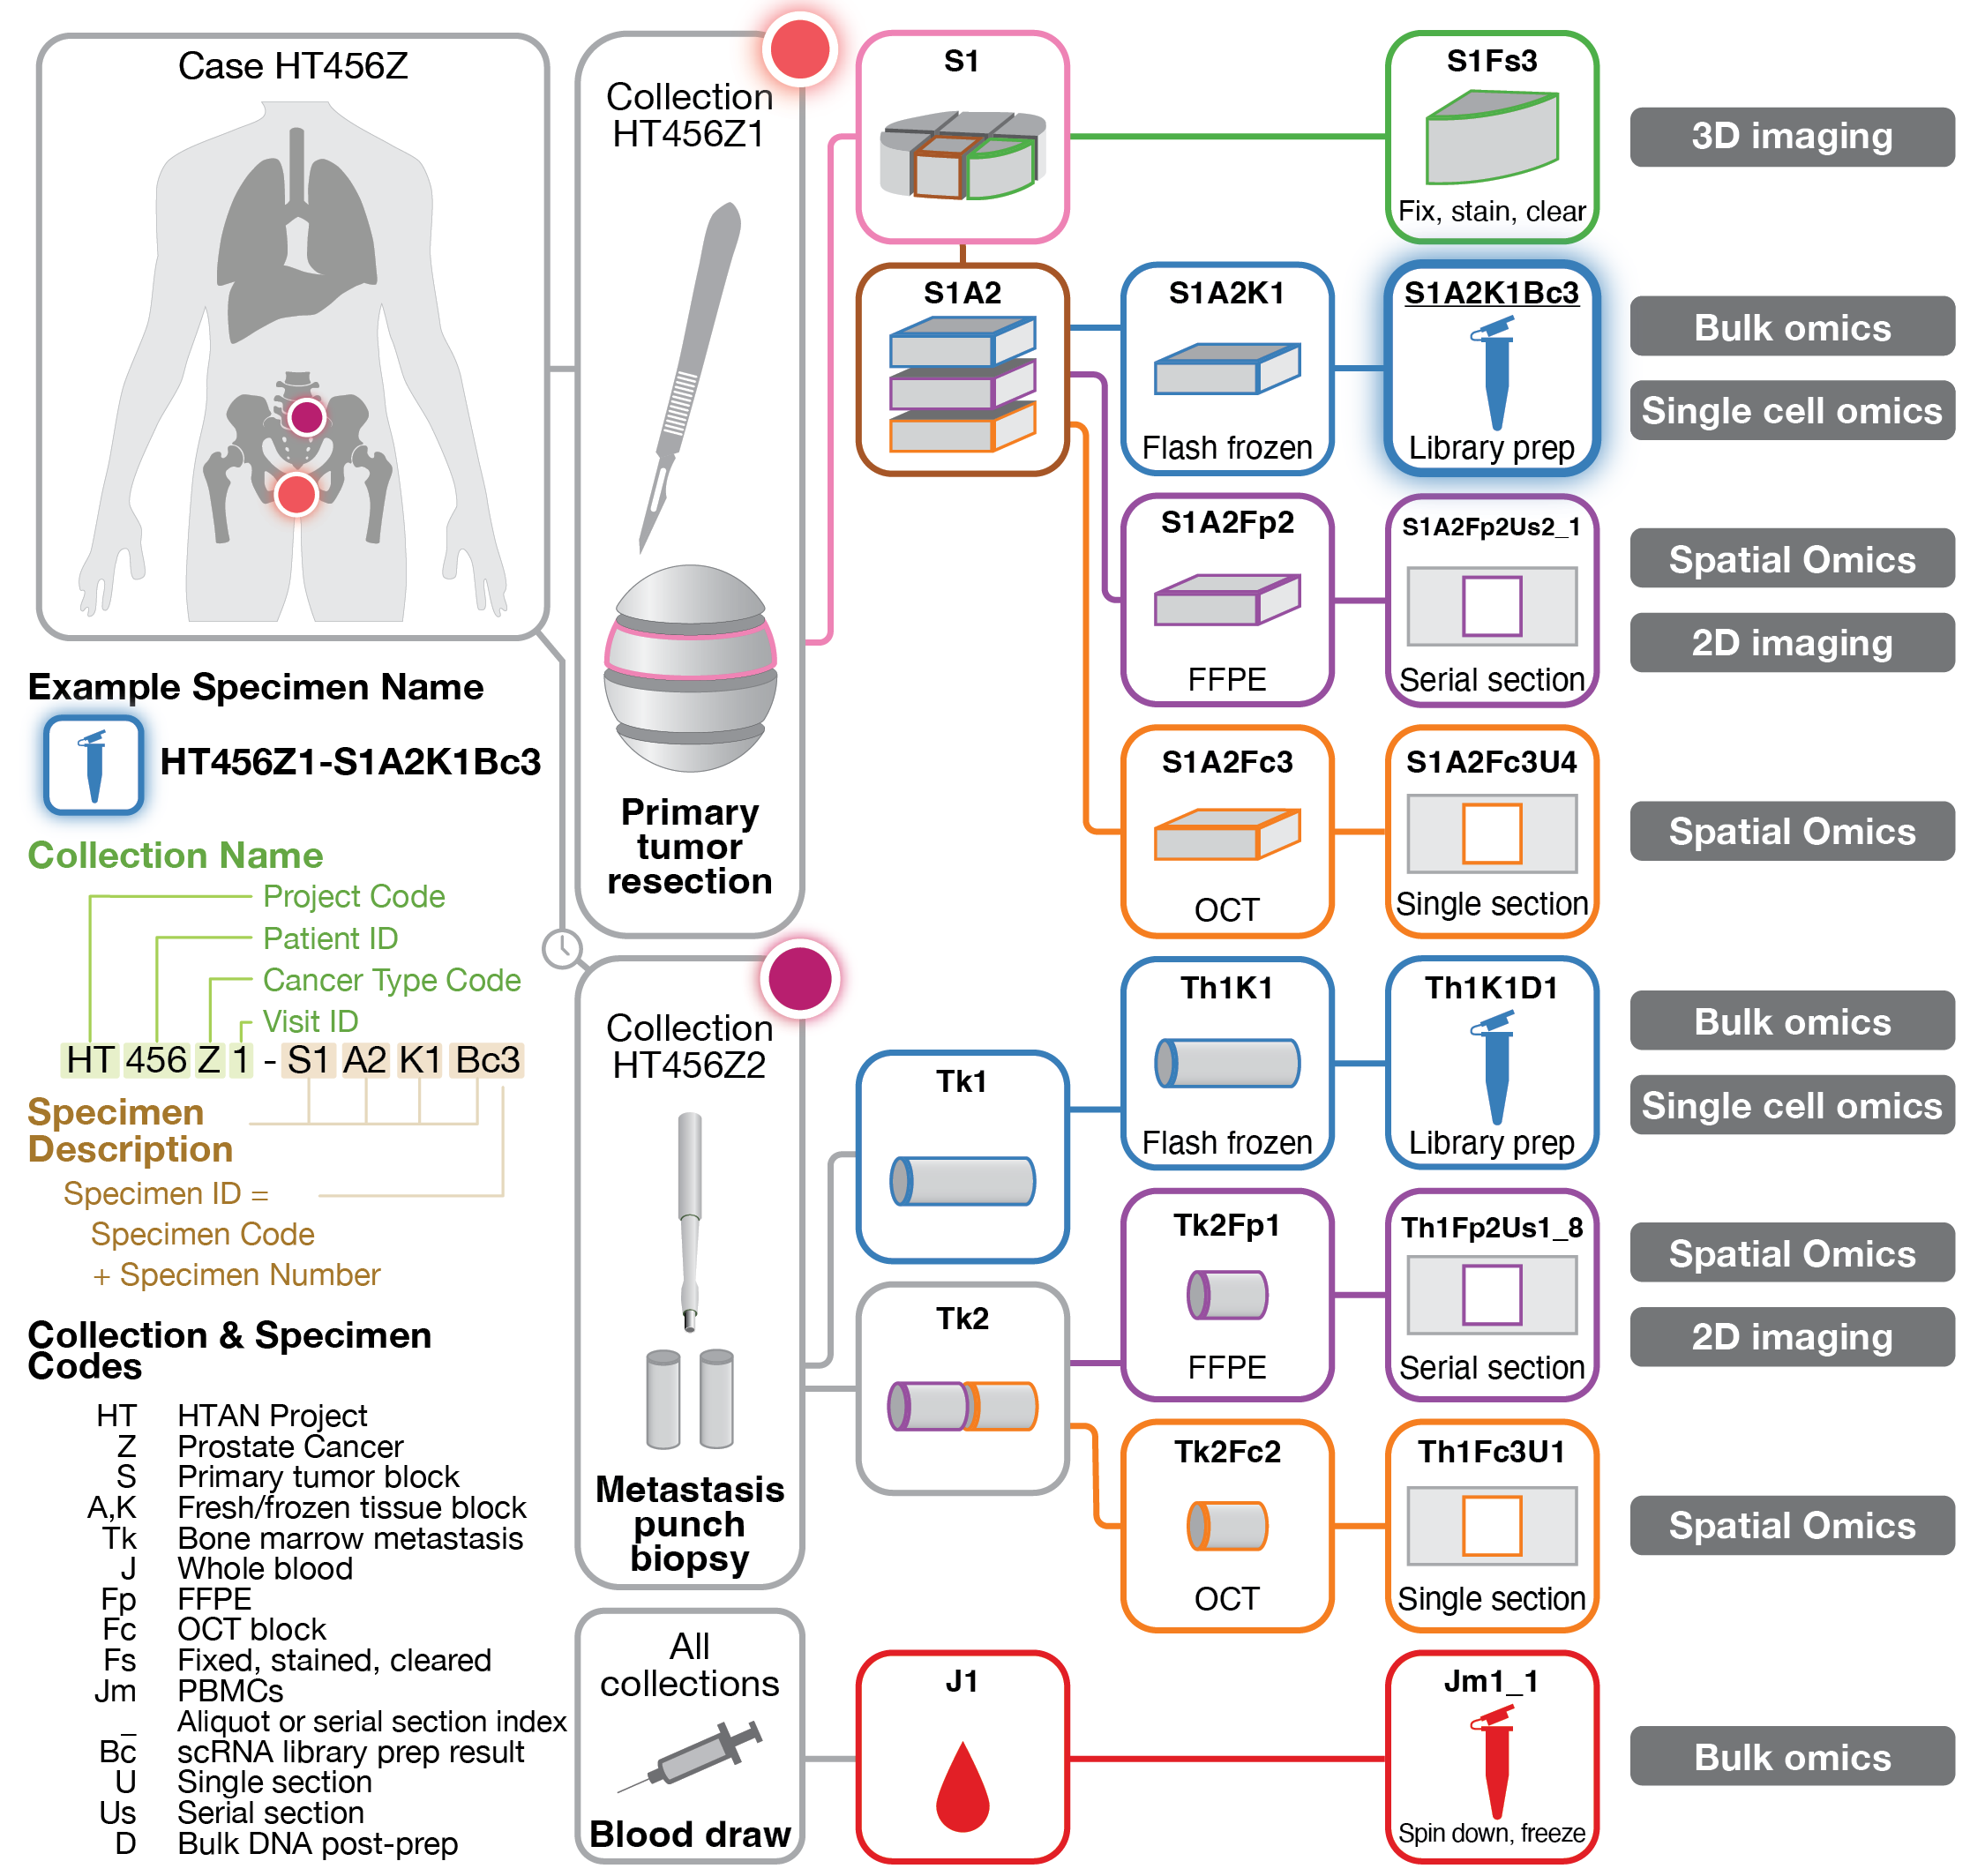
This figure illustates the proposed collection scheme for specimens from a trial participant, yielding a variety of omics-based analyses. It also describes the naming scheme developed in our lab and used for specimen collection and tracking. Figure was part of a successful grant application to HTAN2, with an estimated $17M awarded to Washington University (2024 - 2029).
Patterns of plasma cell subpopulation shift from Primary to Relapse (2021)
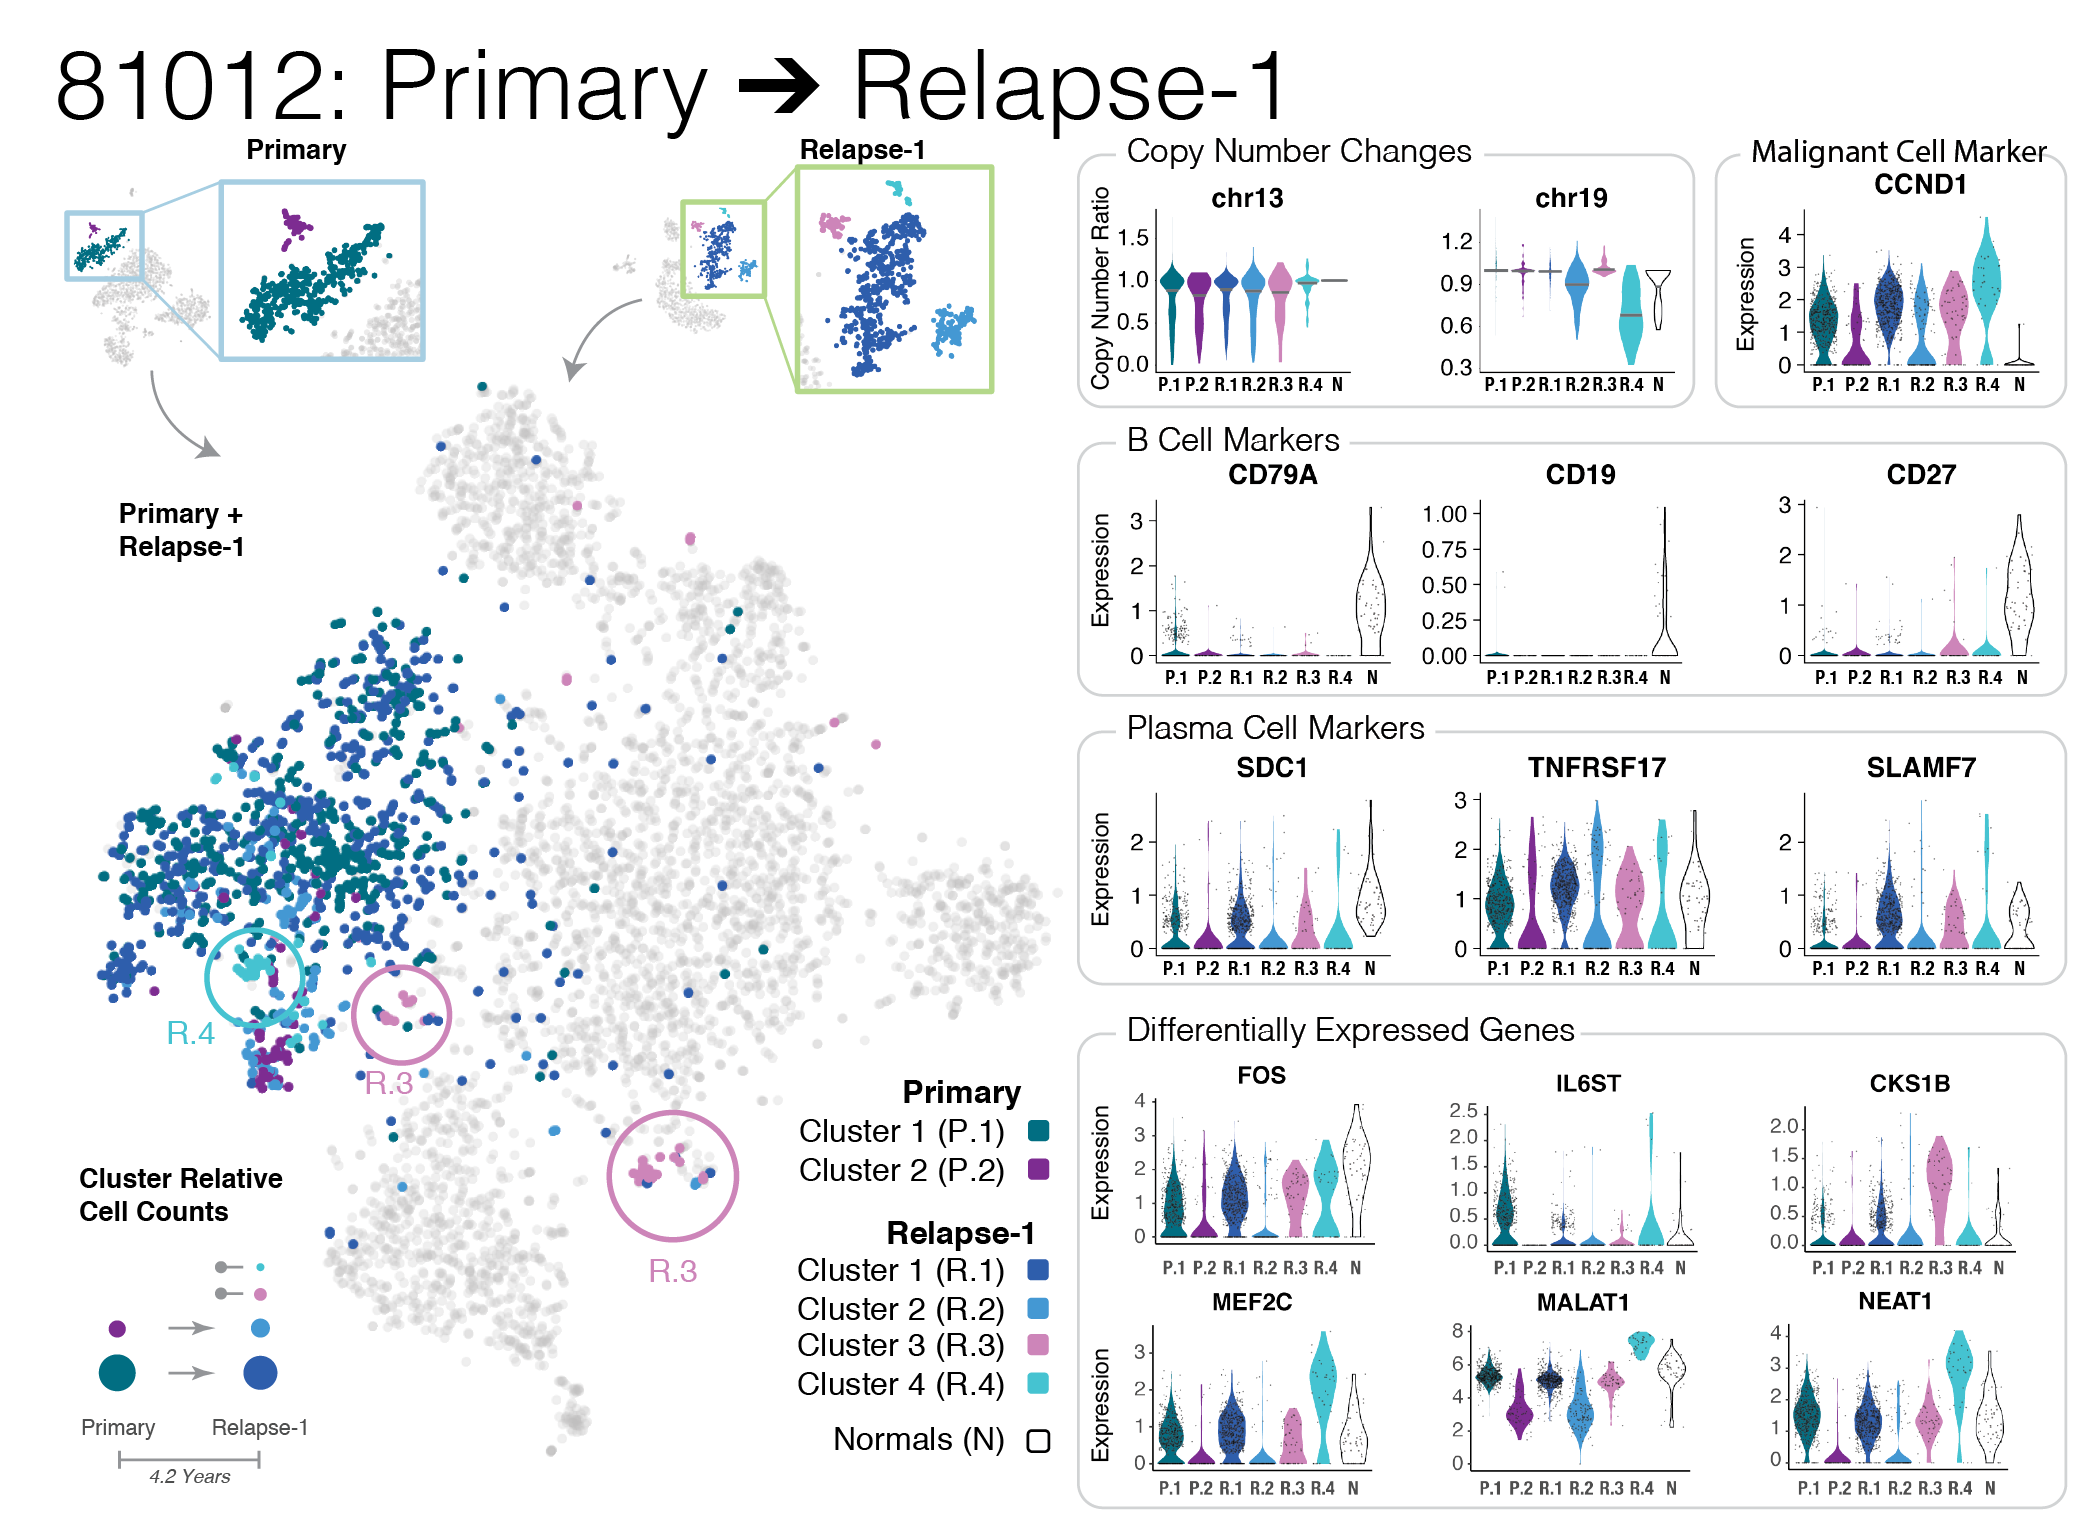
A complex multi-panel data figure illustrating the changes in plasma cell populations in multiple myeloma relapse.
Liu R, Gao Q, Foltz SM, et al. Co-Evolution of Tumor and Immune Cells During Progression of Multiple Myeloma Nat Commun 2021 May 7;12(1):2559. https://www.nature.com/articles/s41467-021-22804-x
Publications
Scientific Software
- TinDaisy
- A SNP / Indel variant caller used for paired tumor / normal variant calling for studying mutations driving cancer. Implemented in CWL workflow language and used for thousands of cases for CPTAC3 and GDAN consortia.
- Breakpoint Surveyor
- A pipeline implemented in R and bash for the analysis and visualization of complex structural variants, in particular virus integration in TCGA whole genome data.
- Matthew A Wyczalkowski, et al., BreakPoint Surveyor: a pipeline for structural variant visualization, Bioinformatics, Volume 33, Issue 19, October 2017, Pages 3121–3122, https://doi.org/10.1093/bioinformatics/btx362